Immigrants from Iraq vs Immigrants from El Salvador Householder Income Ages 25 - 44 years
COMPARE
Immigrants from Iraq
Immigrants from El Salvador
Householder Income Ages 25 - 44 years
Householder Income Ages 25 - 44 years Comparison
Immigrants from Iraq
Immigrants from El Salvador
$89,444
HOUSEHOLDER INCOME AGES 25 - 44 YEARS
5.5/ 100
METRIC RATING
226th/ 347
METRIC RANK
$86,913
HOUSEHOLDER INCOME AGES 25 - 44 YEARS
1.4/ 100
METRIC RATING
245th/ 347
METRIC RANK
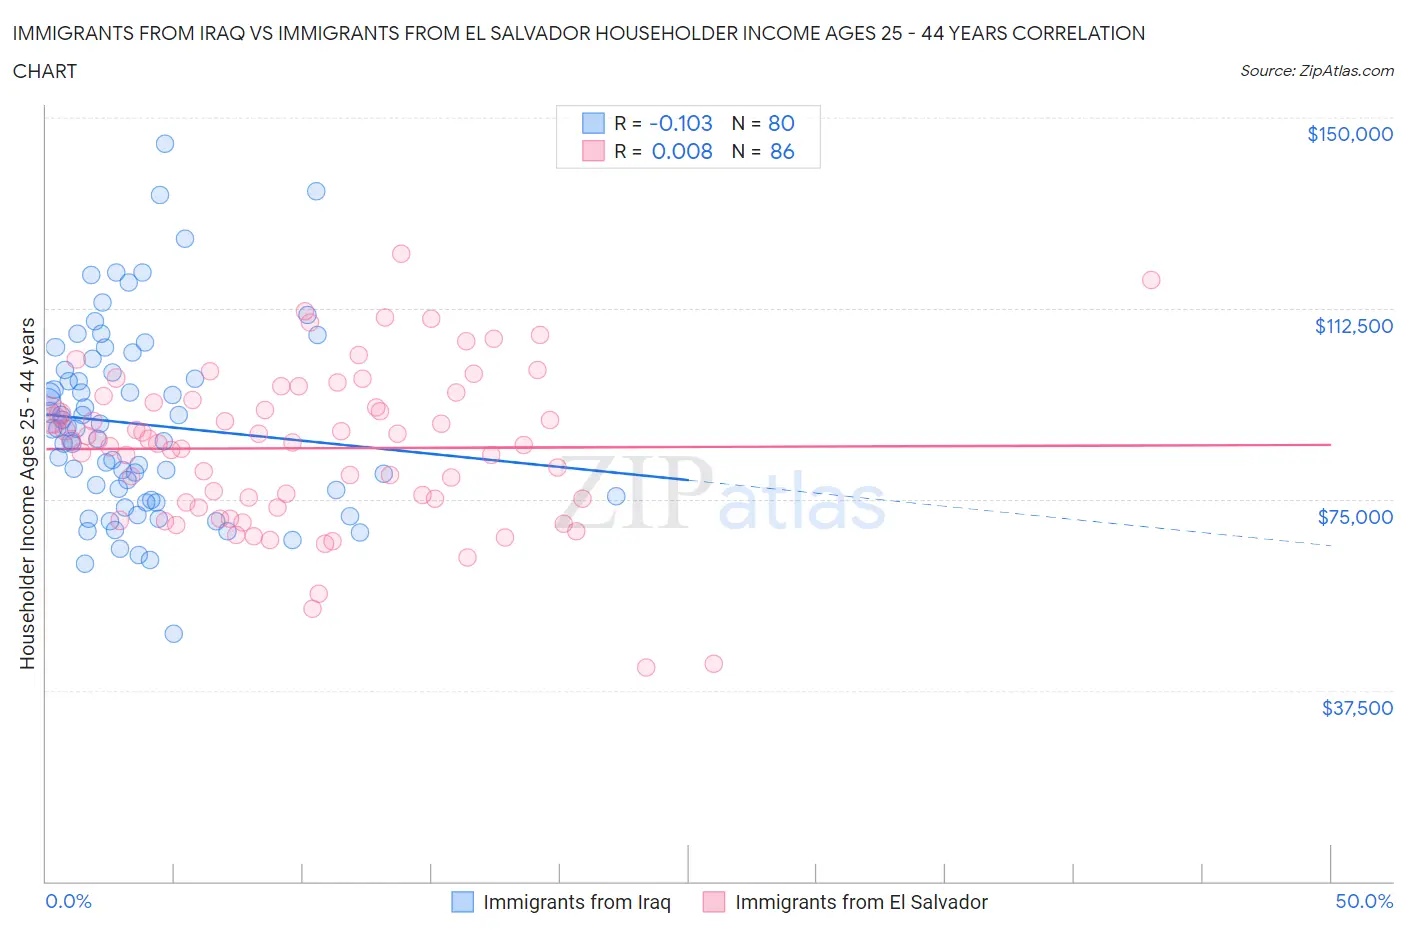
Immigrants from Iraq vs Immigrants from El Salvador Householder Income Ages 25 - 44 years Correlation Chart
The statistical analysis conducted on geographies consisting of 194,665,835 people shows a poor negative correlation between the proportion of Immigrants from Iraq and household income with householder between the ages 25 and 44 in the United States with a correlation coefficient (R) of -0.103 and weighted average of $89,444. Similarly, the statistical analysis conducted on geographies consisting of 357,268,727 people shows no correlation between the proportion of Immigrants from El Salvador and household income with householder between the ages 25 and 44 in the United States with a correlation coefficient (R) of 0.008 and weighted average of $86,913, a difference of 2.9%.
Householder Income Ages 25 - 44 years Correlation Summary
| Measurement | Immigrants from Iraq | Immigrants from El Salvador |
| Minimum | $48,509 | $41,962 |
| Maximum | $144,841 | $123,232 |
| Range | $96,332 | $81,270 |
| Mean | $89,769 | $85,059 |
| Median | $88,796 | $86,368 |
| Interquartile 25% (IQ1) | $75,233 | $74,423 |
| Interquartile 75% (IQ3) | $100,185 | $94,628 |
| Interquartile Range (IQR) | $24,952 | $20,205 |
| Standard Deviation (Sample) | $18,567 | $15,431 |
| Standard Deviation (Population) | $18,451 | $15,341 |
Demographics Similar to Immigrants from Iraq and Immigrants from El Salvador by Householder Income Ages 25 - 44 years
In terms of householder income ages 25 - 44 years, the demographic groups most similar to Immigrants from Iraq are Immigrants from Panama ($89,451, a difference of 0.010%), Immigrants from St. Vincent and the Grenadines ($88,888, a difference of 0.62%), Immigrants from Bosnia and Herzegovina ($88,819, a difference of 0.70%), Immigrants from Barbados ($88,687, a difference of 0.85%), and Alaskan Athabascan ($88,446, a difference of 1.1%). Similarly, the demographic groups most similar to Immigrants from El Salvador are Immigrants from Venezuela ($87,038, a difference of 0.14%), Immigrants from West Indies ($87,063, a difference of 0.17%), West Indian ($87,205, a difference of 0.34%), Nigerian ($87,730, a difference of 0.94%), and Nicaraguan ($87,751, a difference of 0.96%).
| Demographics | Rating | Rank | Householder Income Ages 25 - 44 years |
| Immigrants | Panama | 5.5 /100 | #225 | Tragic $89,451 |
| Immigrants | Iraq | 5.5 /100 | #226 | Tragic $89,444 |
| Immigrants | St. Vincent and the Grenadines | 4.1 /100 | #227 | Tragic $88,888 |
| Immigrants | Bosnia and Herzegovina | 4.0 /100 | #228 | Tragic $88,819 |
| Immigrants | Barbados | 3.7 /100 | #229 | Tragic $88,687 |
| Alaskan Athabascans | 3.3 /100 | #230 | Tragic $88,446 |
| Immigrants | Grenada | 3.0 /100 | #231 | Tragic $88,311 |
| Immigrants | Nonimmigrants | 3.0 /100 | #232 | Tragic $88,301 |
| Malaysians | 3.0 /100 | #233 | Tragic $88,291 |
| Venezuelans | 2.9 /100 | #234 | Tragic $88,232 |
| Bermudans | 2.9 /100 | #235 | Tragic $88,231 |
| Immigrants | Cameroon | 2.9 /100 | #236 | Tragic $88,214 |
| Salvadorans | 2.8 /100 | #237 | Tragic $88,198 |
| Alaska Natives | 2.6 /100 | #238 | Tragic $88,018 |
| Immigrants | Ghana | 2.2 /100 | #239 | Tragic $87,760 |
| Nicaraguans | 2.2 /100 | #240 | Tragic $87,751 |
| Nigerians | 2.2 /100 | #241 | Tragic $87,730 |
| West Indians | 1.7 /100 | #242 | Tragic $87,205 |
| Immigrants | West Indies | 1.5 /100 | #243 | Tragic $87,063 |
| Immigrants | Venezuela | 1.5 /100 | #244 | Tragic $87,038 |
| Immigrants | El Salvador | 1.4 /100 | #245 | Tragic $86,913 |