Immigrants from Syria vs Luxembourger Householder Income Ages 45 - 64 years
COMPARE
Immigrants from Syria
Luxembourger
Householder Income Ages 45 - 64 years
Householder Income Ages 45 - 64 years Comparison
Immigrants from Syria
Luxembourgers
$104,858
HOUSEHOLDER INCOME AGES 45 - 64 YEARS
90.7/ 100
METRIC RATING
131st/ 347
METRIC RANK
$103,536
HOUSEHOLDER INCOME AGES 45 - 64 YEARS
83.3/ 100
METRIC RATING
142nd/ 347
METRIC RANK
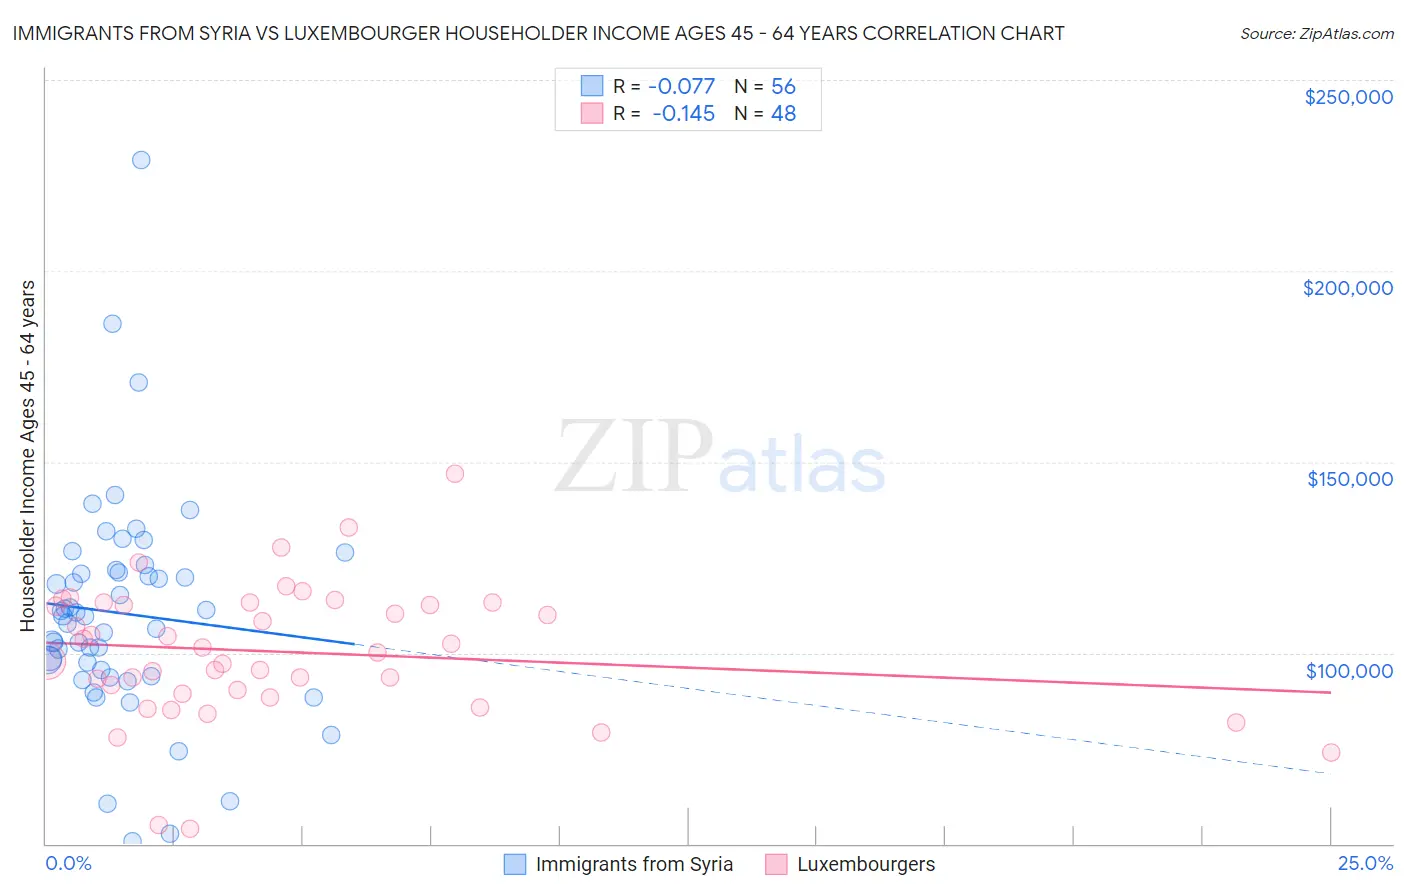
Immigrants from Syria vs Luxembourger Householder Income Ages 45 - 64 years Correlation Chart
The statistical analysis conducted on geographies consisting of 174,068,241 people shows a slight negative correlation between the proportion of Immigrants from Syria and household income with householder between the ages 45 and 64 in the United States with a correlation coefficient (R) of -0.077 and weighted average of $104,858. Similarly, the statistical analysis conducted on geographies consisting of 144,593,524 people shows a poor negative correlation between the proportion of Luxembourgers and household income with householder between the ages 45 and 64 in the United States with a correlation coefficient (R) of -0.145 and weighted average of $103,536, a difference of 1.3%.
Householder Income Ages 45 - 64 years Correlation Summary
| Measurement | Immigrants from Syria | Luxembourger |
| Minimum | $50,774 | $54,000 |
| Maximum | $228,894 | $147,008 |
| Range | $178,120 | $93,008 |
| Mean | $110,346 | $100,224 |
| Median | $109,693 | $100,694 |
| Interquartile 25% (IQ1) | $94,783 | $89,750 |
| Interquartile 75% (IQ3) | $121,434 | $112,857 |
| Interquartile Range (IQR) | $26,651 | $23,108 |
| Standard Deviation (Sample) | $29,383 | $17,750 |
| Standard Deviation (Population) | $29,119 | $17,564 |
Demographics Similar to Immigrants from Syria and Luxembourgers by Householder Income Ages 45 - 64 years
In terms of householder income ages 45 - 64 years, the demographic groups most similar to Immigrants from Syria are Lebanese ($104,734, a difference of 0.12%), Immigrants from Zimbabwe ($104,992, a difference of 0.13%), Peruvian ($105,070, a difference of 0.20%), Native Hawaiian ($105,149, a difference of 0.28%), and Arab ($104,566, a difference of 0.28%). Similarly, the demographic groups most similar to Luxembourgers are Serbian ($103,522, a difference of 0.010%), Czech ($103,507, a difference of 0.030%), Immigrants from Uganda ($103,584, a difference of 0.050%), Ugandan ($103,472, a difference of 0.060%), and Immigrants from Chile ($103,412, a difference of 0.12%).
| Demographics | Rating | Rank | Householder Income Ages 45 - 64 years |
| Portuguese | 92.4 /100 | #126 | Exceptional $105,309 |
| Immigrants | Saudi Arabia | 92.2 /100 | #127 | Exceptional $105,249 |
| Native Hawaiians | 91.8 /100 | #128 | Exceptional $105,149 |
| Peruvians | 91.5 /100 | #129 | Exceptional $105,070 |
| Immigrants | Zimbabwe | 91.2 /100 | #130 | Exceptional $104,992 |
| Immigrants | Syria | 90.7 /100 | #131 | Exceptional $104,858 |
| Lebanese | 90.1 /100 | #132 | Exceptional $104,734 |
| Arabs | 89.3 /100 | #133 | Excellent $104,566 |
| Canadians | 89.3 /100 | #134 | Excellent $104,560 |
| Brazilians | 88.6 /100 | #135 | Excellent $104,408 |
| Taiwanese | 87.4 /100 | #136 | Excellent $104,180 |
| Hungarians | 85.8 /100 | #137 | Excellent $103,913 |
| Ethiopians | 84.7 /100 | #138 | Excellent $103,736 |
| Immigrants | Oceania | 84.5 /100 | #139 | Excellent $103,705 |
| Norwegians | 84.3 /100 | #140 | Excellent $103,682 |
| Immigrants | Uganda | 83.7 /100 | #141 | Excellent $103,584 |
| Luxembourgers | 83.3 /100 | #142 | Excellent $103,536 |
| Serbians | 83.2 /100 | #143 | Excellent $103,522 |
| Czechs | 83.1 /100 | #144 | Excellent $103,507 |
| Ugandans | 82.9 /100 | #145 | Excellent $103,472 |
| Immigrants | Chile | 82.5 /100 | #146 | Excellent $103,412 |