Croatian vs Hispanic or Latino Householder Income Ages 45 - 64 years
COMPARE
Croatian
Hispanic or Latino
Householder Income Ages 45 - 64 years
Householder Income Ages 45 - 64 years Comparison
Croatians
Hispanics or Latinos
$108,383
HOUSEHOLDER INCOME AGES 45 - 64 YEARS
98.3/ 100
METRIC RATING
92nd/ 347
METRIC RANK
$86,006
HOUSEHOLDER INCOME AGES 45 - 64 YEARS
0.1/ 100
METRIC RATING
291st/ 347
METRIC RANK
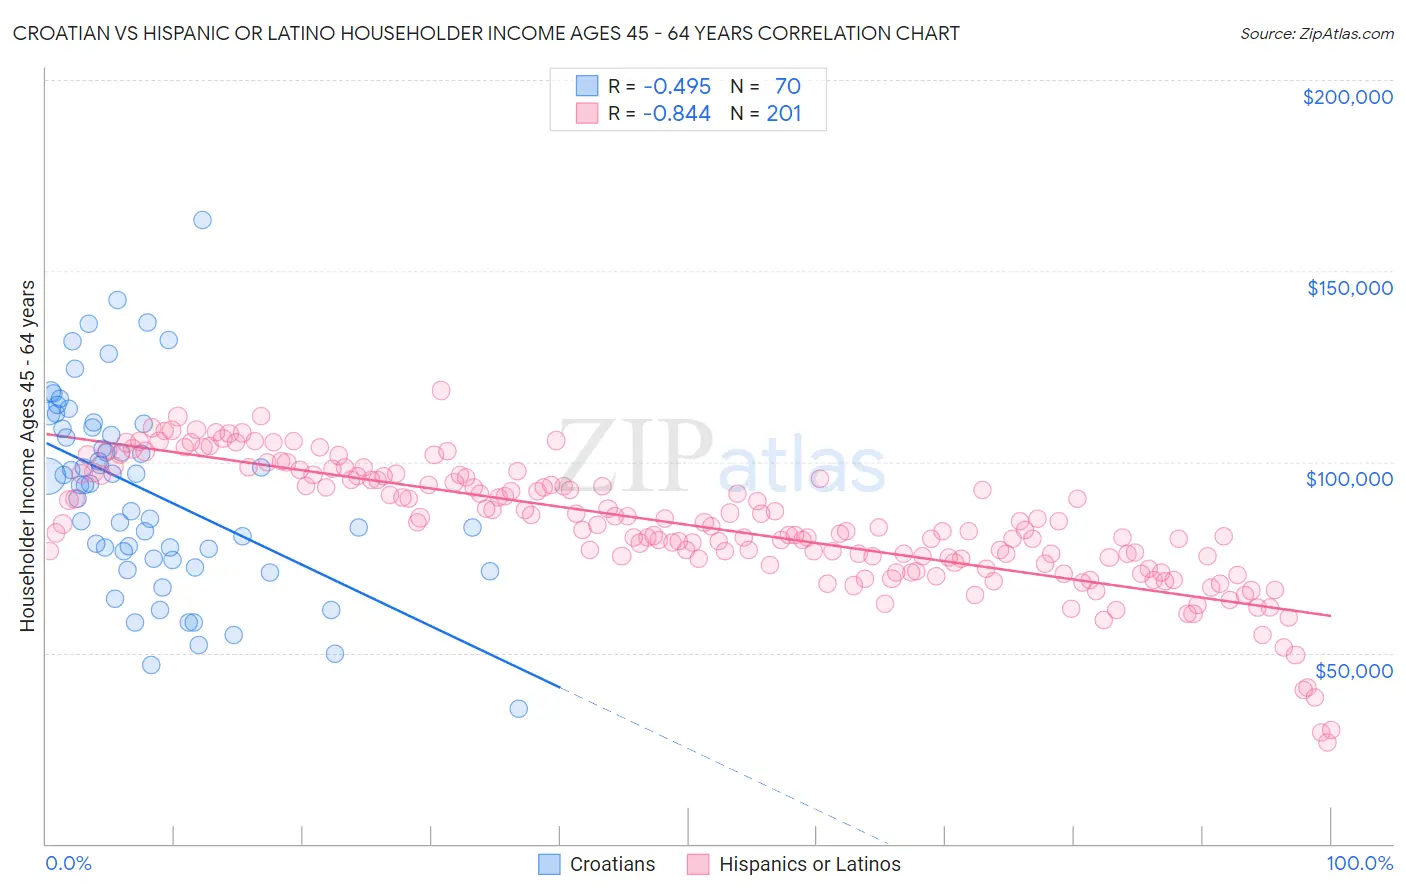
Croatian vs Hispanic or Latino Householder Income Ages 45 - 64 years Correlation Chart
The statistical analysis conducted on geographies consisting of 375,164,056 people shows a moderate negative correlation between the proportion of Croatians and household income with householder between the ages 45 and 64 in the United States with a correlation coefficient (R) of -0.495 and weighted average of $108,383. Similarly, the statistical analysis conducted on geographies consisting of 574,103,825 people shows a very strong negative correlation between the proportion of Hispanics or Latinos and household income with householder between the ages 45 and 64 in the United States with a correlation coefficient (R) of -0.844 and weighted average of $86,006, a difference of 26.0%.
Householder Income Ages 45 - 64 years Correlation Summary
| Measurement | Croatian | Hispanic or Latino |
| Minimum | $35,326 | $26,626 |
| Maximum | $163,438 | $118,670 |
| Range | $128,112 | $92,045 |
| Mean | $92,198 | $83,367 |
| Median | $94,097 | $82,863 |
| Interquartile 25% (IQ1) | $74,551 | $74,106 |
| Interquartile 75% (IQ3) | $109,046 | $96,088 |
| Interquartile Range (IQR) | $34,495 | $21,982 |
| Standard Deviation (Sample) | $25,350 | $16,403 |
| Standard Deviation (Population) | $25,169 | $16,362 |
Similar Demographics by Householder Income Ages 45 - 64 years
Demographics Similar to Croatians by Householder Income Ages 45 - 64 years
In terms of householder income ages 45 - 64 years, the demographic groups most similar to Croatians are Immigrants from Croatia ($108,304, a difference of 0.070%), Ukrainian ($108,475, a difference of 0.080%), Immigrants from Philippines ($108,471, a difference of 0.080%), Immigrants from Lebanon ($108,471, a difference of 0.080%), and Sri Lankan ($108,270, a difference of 0.10%).
| Demographics | Rating | Rank | Householder Income Ages 45 - 64 years |
| Immigrants | Afghanistan | 98.6 /100 | #85 | Exceptional $108,785 |
| Austrians | 98.5 /100 | #86 | Exceptional $108,692 |
| Tongans | 98.5 /100 | #87 | Exceptional $108,643 |
| Romanians | 98.5 /100 | #88 | Exceptional $108,609 |
| Ukrainians | 98.3 /100 | #89 | Exceptional $108,475 |
| Immigrants | Philippines | 98.3 /100 | #90 | Exceptional $108,471 |
| Immigrants | Lebanon | 98.3 /100 | #91 | Exceptional $108,471 |
| Croatians | 98.3 /100 | #92 | Exceptional $108,383 |
| Immigrants | Croatia | 98.2 /100 | #93 | Exceptional $108,304 |
| Sri Lankans | 98.2 /100 | #94 | Exceptional $108,270 |
| Immigrants | Hungary | 98.2 /100 | #95 | Exceptional $108,267 |
| Immigrants | Argentina | 98.2 /100 | #96 | Exceptional $108,264 |
| Northern Europeans | 97.8 /100 | #97 | Exceptional $107,870 |
| Immigrants | Southern Europe | 97.7 /100 | #98 | Exceptional $107,775 |
| Palestinians | 97.6 /100 | #99 | Exceptional $107,721 |
Demographics Similar to Hispanics or Latinos by Householder Income Ages 45 - 64 years
In terms of householder income ages 45 - 64 years, the demographic groups most similar to Hispanics or Latinos are Immigrants from Central America ($85,965, a difference of 0.050%), Cherokee ($86,125, a difference of 0.14%), Comanche ($85,787, a difference of 0.25%), Cuban ($86,301, a difference of 0.34%), and Immigrants from St. Vincent and the Grenadines ($86,394, a difference of 0.45%).
| Demographics | Rating | Rank | Householder Income Ages 45 - 64 years |
| Central American Indians | 0.1 /100 | #284 | Tragic $86,764 |
| Blackfeet | 0.1 /100 | #285 | Tragic $86,595 |
| Immigrants | Guatemala | 0.1 /100 | #286 | Tragic $86,573 |
| Bangladeshis | 0.1 /100 | #287 | Tragic $86,402 |
| Immigrants | St. Vincent and the Grenadines | 0.1 /100 | #288 | Tragic $86,394 |
| Cubans | 0.1 /100 | #289 | Tragic $86,301 |
| Cherokee | 0.1 /100 | #290 | Tragic $86,125 |
| Hispanics or Latinos | 0.1 /100 | #291 | Tragic $86,006 |
| Immigrants | Central America | 0.1 /100 | #292 | Tragic $85,965 |
| Comanche | 0.1 /100 | #293 | Tragic $85,787 |
| British West Indians | 0.1 /100 | #294 | Tragic $85,571 |
| Immigrants | Grenada | 0.1 /100 | #295 | Tragic $85,552 |
| Immigrants | Zaire | 0.1 /100 | #296 | Tragic $85,207 |
| Fijians | 0.1 /100 | #297 | Tragic $85,187 |
| Africans | 0.0 /100 | #298 | Tragic $84,925 |