Immigrants from Afghanistan vs Immigrants from Taiwan Median Earnings
COMPARE
Immigrants from Afghanistan
Immigrants from Taiwan
Median Earnings
Median Earnings Comparison
Immigrants from Afghanistan
Immigrants from Taiwan
$49,645
MEDIAN EARNINGS
98.9/ 100
METRIC RATING
99th/ 347
METRIC RANK
$61,151
MEDIAN EARNINGS
100.0/ 100
METRIC RATING
2nd/ 347
METRIC RANK
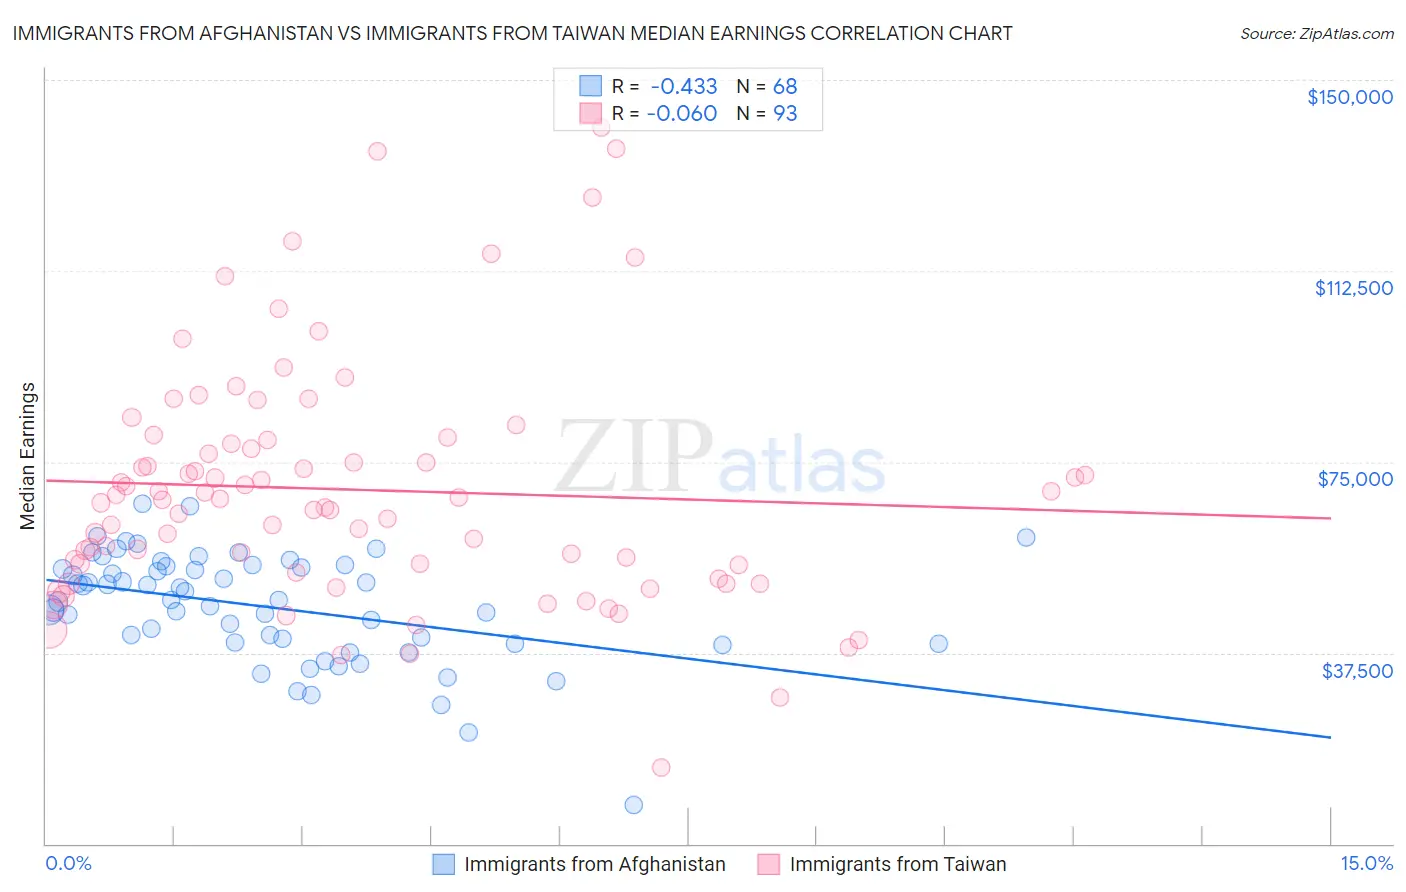
Immigrants from Afghanistan vs Immigrants from Taiwan Median Earnings Correlation Chart
The statistical analysis conducted on geographies consisting of 147,645,000 people shows a moderate negative correlation between the proportion of Immigrants from Afghanistan and median earnings in the United States with a correlation coefficient (R) of -0.433 and weighted average of $49,645. Similarly, the statistical analysis conducted on geographies consisting of 298,281,567 people shows a slight negative correlation between the proportion of Immigrants from Taiwan and median earnings in the United States with a correlation coefficient (R) of -0.060 and weighted average of $61,151, a difference of 23.2%.
Median Earnings Correlation Summary
| Measurement | Immigrants from Afghanistan | Immigrants from Taiwan |
| Minimum | $7,703 | $15,000 |
| Maximum | $66,757 | $140,742 |
| Range | $59,054 | $125,742 |
| Mean | $46,511 | $69,540 |
| Median | $47,775 | $67,496 |
| Interquartile 25% (IQ1) | $39,495 | $54,032 |
| Interquartile 75% (IQ3) | $54,376 | $78,915 |
| Interquartile Range (IQR) | $14,881 | $24,883 |
| Standard Deviation (Sample) | $10,763 | $23,624 |
| Standard Deviation (Population) | $10,683 | $23,497 |
Similar Demographics by Median Earnings
Demographics Similar to Immigrants from Afghanistan by Median Earnings
In terms of median earnings, the demographic groups most similar to Immigrants from Afghanistan are Immigrants from Northern Africa ($49,648, a difference of 0.010%), Immigrants from Poland ($49,633, a difference of 0.020%), Immigrants from North Macedonia ($49,658, a difference of 0.030%), Jordanian ($49,632, a difference of 0.030%), and Immigrants from Lebanon ($49,682, a difference of 0.070%).
| Demographics | Rating | Rank | Median Earnings |
| Immigrants | Argentina | 99.2 /100 | #92 | Exceptional $49,841 |
| Armenians | 99.1 /100 | #93 | Exceptional $49,804 |
| Croatians | 99.0 /100 | #94 | Exceptional $49,724 |
| Immigrants | England | 99.0 /100 | #95 | Exceptional $49,722 |
| Immigrants | Lebanon | 99.0 /100 | #96 | Exceptional $49,682 |
| Immigrants | North Macedonia | 98.9 /100 | #97 | Exceptional $49,658 |
| Immigrants | Northern Africa | 98.9 /100 | #98 | Exceptional $49,648 |
| Immigrants | Afghanistan | 98.9 /100 | #99 | Exceptional $49,645 |
| Immigrants | Poland | 98.9 /100 | #100 | Exceptional $49,633 |
| Jordanians | 98.9 /100 | #101 | Exceptional $49,632 |
| Ethiopians | 98.8 /100 | #102 | Exceptional $49,572 |
| Austrians | 98.7 /100 | #103 | Exceptional $49,501 |
| Immigrants | Brazil | 98.6 /100 | #104 | Exceptional $49,463 |
| Immigrants | Western Asia | 98.4 /100 | #105 | Exceptional $49,389 |
| Immigrants | Albania | 98.4 /100 | #106 | Exceptional $49,377 |
Demographics Similar to Immigrants from Taiwan by Median Earnings
In terms of median earnings, the demographic groups most similar to Immigrants from Taiwan are Filipino ($61,197, a difference of 0.080%), Immigrants from India ($60,648, a difference of 0.83%), Immigrants from Hong Kong ($59,433, a difference of 2.9%), Thai ($59,237, a difference of 3.2%), and Immigrants from Singapore ($59,038, a difference of 3.6%).
| Demographics | Rating | Rank | Median Earnings |
| Filipinos | 100.0 /100 | #1 | Exceptional $61,197 |
| Immigrants | Taiwan | 100.0 /100 | #2 | Exceptional $61,151 |
| Immigrants | India | 100.0 /100 | #3 | Exceptional $60,648 |
| Immigrants | Hong Kong | 100.0 /100 | #4 | Exceptional $59,433 |
| Thais | 100.0 /100 | #5 | Exceptional $59,237 |
| Immigrants | Singapore | 100.0 /100 | #6 | Exceptional $59,038 |
| Iranians | 100.0 /100 | #7 | Exceptional $58,474 |
| Immigrants | Iran | 100.0 /100 | #8 | Exceptional $57,612 |
| Okinawans | 100.0 /100 | #9 | Exceptional $57,550 |
| Immigrants | South Central Asia | 100.0 /100 | #10 | Exceptional $57,114 |
| Immigrants | Israel | 100.0 /100 | #11 | Exceptional $57,034 |
| Immigrants | Ireland | 100.0 /100 | #12 | Exceptional $56,854 |
| Immigrants | China | 100.0 /100 | #13 | Exceptional $56,638 |
| Immigrants | Australia | 100.0 /100 | #14 | Exceptional $56,305 |
| Indians (Asian) | 100.0 /100 | #15 | Exceptional $56,253 |