Immigrants from Singapore vs Panamanian Householder Income Ages 25 - 44 years
COMPARE
Immigrants from Singapore
Panamanian
Householder Income Ages 25 - 44 years
Householder Income Ages 25 - 44 years Comparison
Immigrants from Singapore
Panamanians
$124,429
HOUSEHOLDER INCOME AGES 25 - 44 YEARS
100.0/ 100
METRIC RATING
4th/ 347
METRIC RANK
$90,193
HOUSEHOLDER INCOME AGES 25 - 44 YEARS
8.1/ 100
METRIC RATING
215th/ 347
METRIC RANK
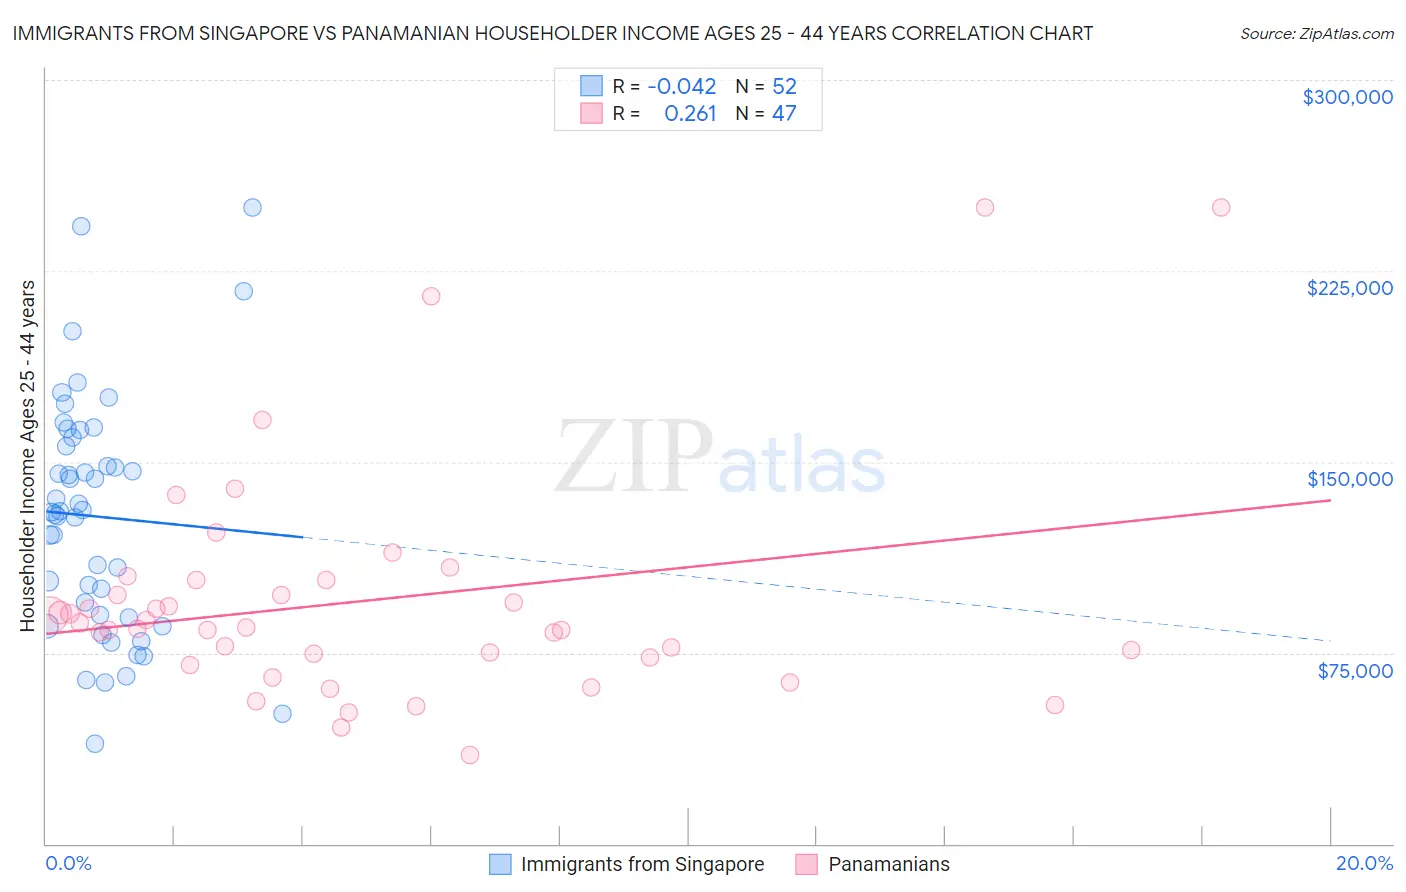
Immigrants from Singapore vs Panamanian Householder Income Ages 25 - 44 years Correlation Chart
The statistical analysis conducted on geographies consisting of 137,346,360 people shows no correlation between the proportion of Immigrants from Singapore and household income with householder between the ages 25 and 44 in the United States with a correlation coefficient (R) of -0.042 and weighted average of $124,429. Similarly, the statistical analysis conducted on geographies consisting of 280,855,443 people shows a weak positive correlation between the proportion of Panamanians and household income with householder between the ages 25 and 44 in the United States with a correlation coefficient (R) of 0.261 and weighted average of $90,193, a difference of 38.0%.
Householder Income Ages 25 - 44 years Correlation Summary
| Measurement | Immigrants from Singapore | Panamanian |
| Minimum | $39,441 | $34,890 |
| Maximum | $250,001 | $250,001 |
| Range | $210,560 | $215,111 |
| Mean | $128,508 | $95,499 |
| Median | $130,454 | $85,019 |
| Interquartile 25% (IQ1) | $89,308 | $72,969 |
| Interquartile 75% (IQ3) | $157,929 | $103,669 |
| Interquartile Range (IQR) | $68,620 | $30,700 |
| Standard Deviation (Sample) | $46,353 | $45,169 |
| Standard Deviation (Population) | $45,905 | $44,686 |
Similar Demographics by Householder Income Ages 25 - 44 years
Demographics Similar to Immigrants from Singapore by Householder Income Ages 25 - 44 years
In terms of householder income ages 25 - 44 years, the demographic groups most similar to Immigrants from Singapore are Immigrants from India ($124,238, a difference of 0.15%), Thai ($121,778, a difference of 2.2%), Immigrants from Hong Kong ($128,140, a difference of 3.0%), Immigrants from Ireland ($120,333, a difference of 3.4%), and Iranian ($120,292, a difference of 3.4%).
| Demographics | Rating | Rank | Householder Income Ages 25 - 44 years |
| Immigrants | Taiwan | 100.0 /100 | #1 | Exceptional $129,122 |
| Filipinos | 100.0 /100 | #2 | Exceptional $128,723 |
| Immigrants | Hong Kong | 100.0 /100 | #3 | Exceptional $128,140 |
| Immigrants | Singapore | 100.0 /100 | #4 | Exceptional $124,429 |
| Immigrants | India | 100.0 /100 | #5 | Exceptional $124,238 |
| Thais | 100.0 /100 | #6 | Exceptional $121,778 |
| Immigrants | Ireland | 100.0 /100 | #7 | Exceptional $120,333 |
| Iranians | 100.0 /100 | #8 | Exceptional $120,292 |
| Immigrants | China | 100.0 /100 | #9 | Exceptional $119,756 |
| Indians (Asian) | 100.0 /100 | #10 | Exceptional $119,496 |
| Okinawans | 100.0 /100 | #11 | Exceptional $119,349 |
| Immigrants | Iran | 100.0 /100 | #12 | Exceptional $119,204 |
| Immigrants | Eastern Asia | 100.0 /100 | #13 | Exceptional $118,056 |
| Immigrants | Israel | 100.0 /100 | #14 | Exceptional $117,219 |
| Immigrants | South Central Asia | 100.0 /100 | #15 | Exceptional $116,626 |
Demographics Similar to Panamanians by Householder Income Ages 25 - 44 years
In terms of householder income ages 25 - 44 years, the demographic groups most similar to Panamanians are Ghanaian ($90,137, a difference of 0.060%), Immigrants from Africa ($90,372, a difference of 0.20%), Scotch-Irish ($89,969, a difference of 0.25%), Immigrants from Bangladesh ($90,448, a difference of 0.28%), and Guyanese ($89,940, a difference of 0.28%).
| Demographics | Rating | Rank | Householder Income Ages 25 - 44 years |
| Immigrants | Thailand | 14.3 /100 | #208 | Poor $91,337 |
| Immigrants | Uruguay | 13.2 /100 | #209 | Poor $91,171 |
| Immigrants | Kenya | 10.9 /100 | #210 | Poor $90,767 |
| Iraqis | 10.8 /100 | #211 | Poor $90,764 |
| Hawaiians | 10.6 /100 | #212 | Poor $90,722 |
| Immigrants | Bangladesh | 9.3 /100 | #213 | Tragic $90,448 |
| Immigrants | Africa | 8.9 /100 | #214 | Tragic $90,372 |
| Panamanians | 8.1 /100 | #215 | Tragic $90,193 |
| Ghanaians | 7.9 /100 | #216 | Tragic $90,137 |
| Scotch-Irish | 7.3 /100 | #217 | Tragic $89,969 |
| Guyanese | 7.1 /100 | #218 | Tragic $89,940 |
| Delaware | 6.9 /100 | #219 | Tragic $89,876 |
| Trinidadians and Tobagonians | 6.8 /100 | #220 | Tragic $89,856 |
| Immigrants | Trinidad and Tobago | 6.5 /100 | #221 | Tragic $89,748 |
| Immigrants | Ecuador | 6.2 /100 | #222 | Tragic $89,673 |