Immigrants from St. Vincent and the Grenadines vs New Zealander Householder Income Over 65 years
COMPARE
Immigrants from St. Vincent and the Grenadines
New Zealander
Householder Income Over 65 years
Householder Income Over 65 years Comparison
Immigrants from St. Vincent and the Grenadines
New Zealanders
$51,922
HOUSEHOLDER INCOME OVER 65 YEARS
0.0/ 100
METRIC RATING
317th/ 347
METRIC RANK
$67,333
HOUSEHOLDER INCOME OVER 65 YEARS
99.9/ 100
METRIC RATING
42nd/ 347
METRIC RANK
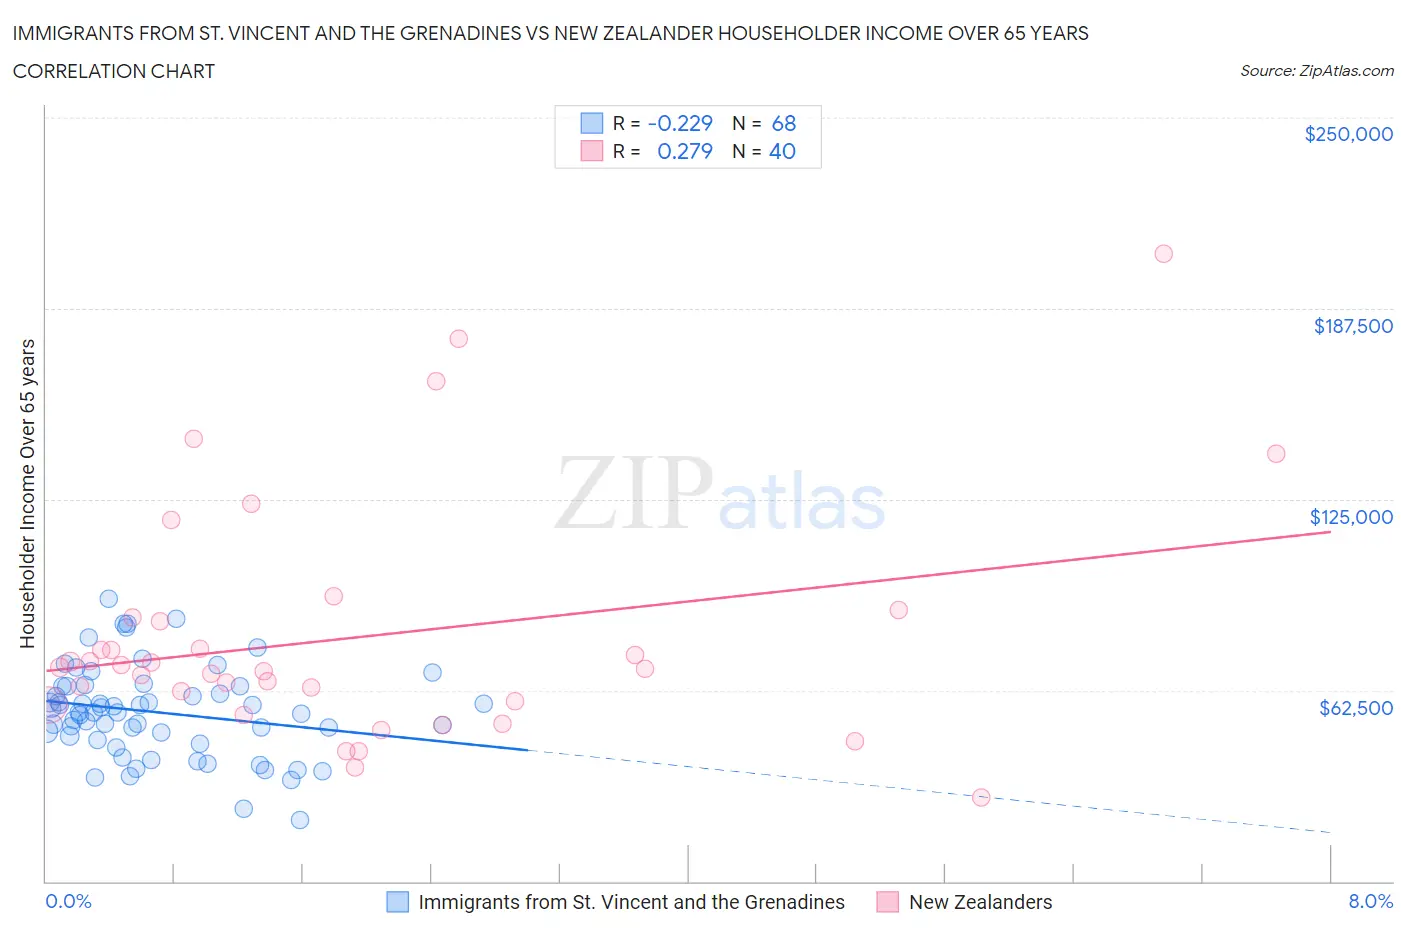
Immigrants from St. Vincent and the Grenadines vs New Zealander Householder Income Over 65 years Correlation Chart
The statistical analysis conducted on geographies consisting of 56,083,618 people shows a weak negative correlation between the proportion of Immigrants from St. Vincent and the Grenadines and household income with householder over the age of 65 in the United States with a correlation coefficient (R) of -0.229 and weighted average of $51,922. Similarly, the statistical analysis conducted on geographies consisting of 106,796,151 people shows a weak positive correlation between the proportion of New Zealanders and household income with householder over the age of 65 in the United States with a correlation coefficient (R) of 0.279 and weighted average of $67,333, a difference of 29.7%.
Householder Income Over 65 years Correlation Summary
| Measurement | Immigrants from St. Vincent and the Grenadines | New Zealander |
| Minimum | $19,854 | $27,419 |
| Maximum | $92,344 | $205,469 |
| Range | $72,490 | $178,050 |
| Mean | $55,268 | $79,932 |
| Median | $55,309 | $69,710 |
| Interquartile 25% (IQ1) | $46,915 | $58,322 |
| Interquartile 75% (IQ3) | $63,847 | $85,553 |
| Interquartile Range (IQR) | $16,932 | $27,231 |
| Standard Deviation (Sample) | $14,822 | $38,798 |
| Standard Deviation (Population) | $14,713 | $38,310 |
Similar Demographics by Householder Income Over 65 years
Demographics Similar to Immigrants from St. Vincent and the Grenadines by Householder Income Over 65 years
In terms of householder income over 65 years, the demographic groups most similar to Immigrants from St. Vincent and the Grenadines are Haitian ($51,912, a difference of 0.020%), Creek ($51,949, a difference of 0.050%), Immigrants from Honduras ($51,888, a difference of 0.070%), U.S. Virgin Islander ($52,072, a difference of 0.29%), and Native/Alaskan ($52,081, a difference of 0.30%).
| Demographics | Rating | Rank | Householder Income Over 65 years |
| Sioux | 0.0 /100 | #310 | Tragic $52,509 |
| Seminole | 0.0 /100 | #311 | Tragic $52,373 |
| Immigrants | Azores | 0.0 /100 | #312 | Tragic $52,121 |
| Immigrants | Nicaragua | 0.0 /100 | #313 | Tragic $52,085 |
| Natives/Alaskans | 0.0 /100 | #314 | Tragic $52,081 |
| U.S. Virgin Islanders | 0.0 /100 | #315 | Tragic $52,072 |
| Creek | 0.0 /100 | #316 | Tragic $51,949 |
| Immigrants | St. Vincent and the Grenadines | 0.0 /100 | #317 | Tragic $51,922 |
| Haitians | 0.0 /100 | #318 | Tragic $51,912 |
| Immigrants | Honduras | 0.0 /100 | #319 | Tragic $51,888 |
| Colville | 0.0 /100 | #320 | Tragic $51,739 |
| Menominee | 0.0 /100 | #321 | Tragic $51,719 |
| British West Indians | 0.0 /100 | #322 | Tragic $51,463 |
| Cajuns | 0.0 /100 | #323 | Tragic $51,397 |
| Immigrants | Congo | 0.0 /100 | #324 | Tragic $51,393 |
Demographics Similar to New Zealanders by Householder Income Over 65 years
In terms of householder income over 65 years, the demographic groups most similar to New Zealanders are Latvian ($67,326, a difference of 0.010%), Immigrants from South Africa ($67,234, a difference of 0.15%), Korean ($67,472, a difference of 0.21%), Immigrants from Asia ($67,594, a difference of 0.39%), and Russian ($67,626, a difference of 0.44%).
| Demographics | Rating | Rank | Householder Income Over 65 years |
| Tongans | 100.0 /100 | #35 | Exceptional $68,235 |
| Immigrants | Austria | 99.9 /100 | #36 | Exceptional $68,208 |
| Turks | 99.9 /100 | #37 | Exceptional $68,037 |
| Estonians | 99.9 /100 | #38 | Exceptional $67,926 |
| Russians | 99.9 /100 | #39 | Exceptional $67,626 |
| Immigrants | Asia | 99.9 /100 | #40 | Exceptional $67,594 |
| Koreans | 99.9 /100 | #41 | Exceptional $67,472 |
| New Zealanders | 99.9 /100 | #42 | Exceptional $67,333 |
| Latvians | 99.9 /100 | #43 | Exceptional $67,326 |
| Immigrants | South Africa | 99.9 /100 | #44 | Exceptional $67,234 |
| Immigrants | Afghanistan | 99.8 /100 | #45 | Exceptional $67,007 |
| Cambodians | 99.8 /100 | #46 | Exceptional $66,892 |
| Australians | 99.8 /100 | #47 | Exceptional $66,891 |
| Immigrants | France | 99.8 /100 | #48 | Exceptional $66,826 |
| Immigrants | Indonesia | 99.8 /100 | #49 | Exceptional $66,694 |