Immigrants from Dominica vs New Zealander Householder Income Over 65 years
COMPARE
Immigrants from Dominica
New Zealander
Householder Income Over 65 years
Householder Income Over 65 years Comparison
Immigrants from Dominica
New Zealanders
$50,071
HOUSEHOLDER INCOME OVER 65 YEARS
0.0/ 100
METRIC RATING
334th/ 347
METRIC RANK
$67,333
HOUSEHOLDER INCOME OVER 65 YEARS
99.9/ 100
METRIC RATING
42nd/ 347
METRIC RANK
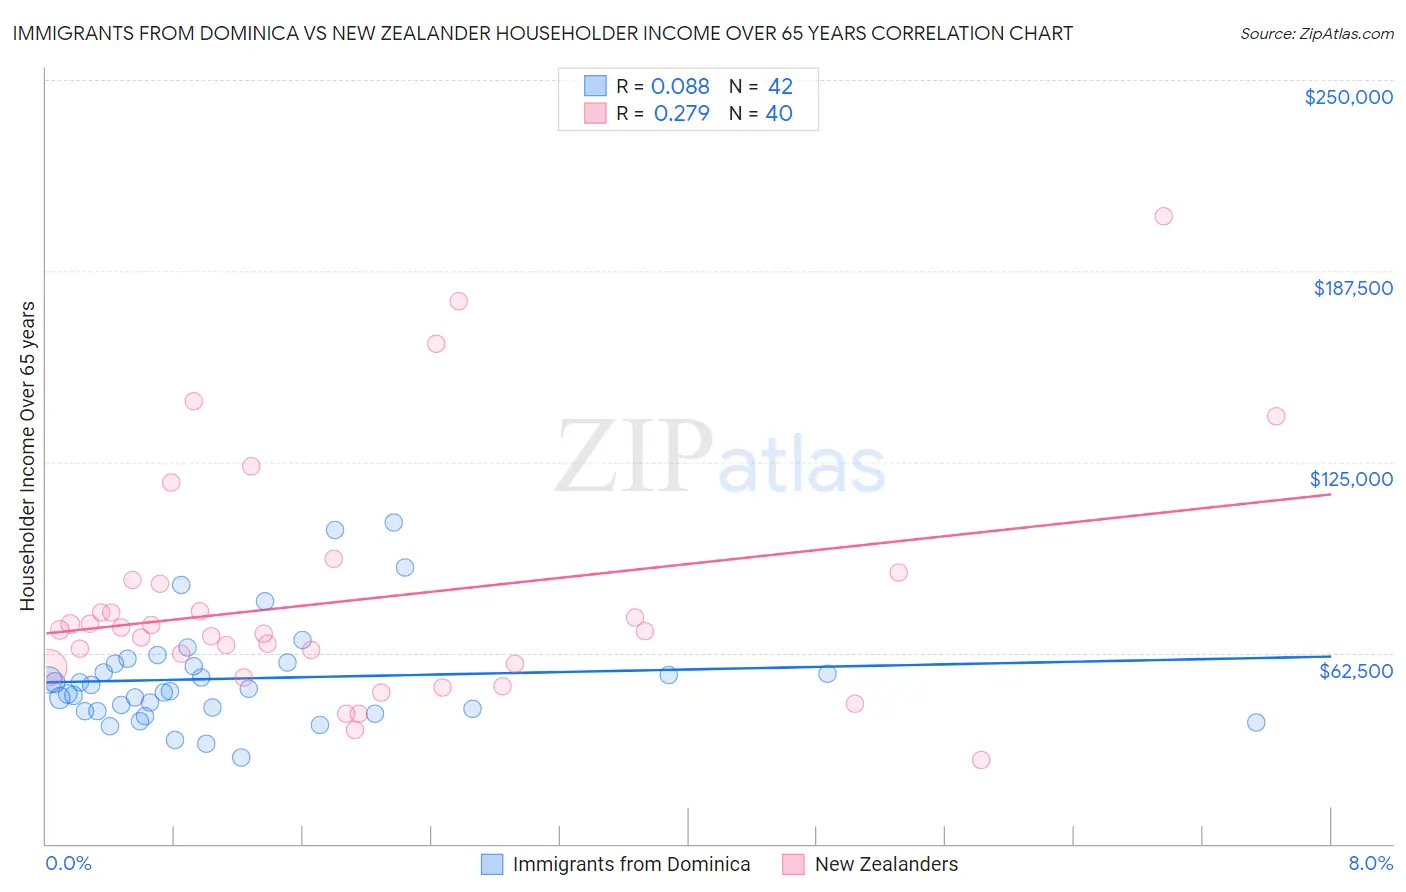
Immigrants from Dominica vs New Zealander Householder Income Over 65 years Correlation Chart
The statistical analysis conducted on geographies consisting of 83,672,003 people shows a slight positive correlation between the proportion of Immigrants from Dominica and household income with householder over the age of 65 in the United States with a correlation coefficient (R) of 0.088 and weighted average of $50,071. Similarly, the statistical analysis conducted on geographies consisting of 106,796,151 people shows a weak positive correlation between the proportion of New Zealanders and household income with householder over the age of 65 in the United States with a correlation coefficient (R) of 0.279 and weighted average of $67,333, a difference of 34.5%.
Householder Income Over 65 years Correlation Summary
| Measurement | Immigrants from Dominica | New Zealander |
| Minimum | $28,256 | $27,419 |
| Maximum | $105,250 | $205,469 |
| Range | $76,994 | $178,050 |
| Mean | $54,080 | $79,932 |
| Median | $50,392 | $69,710 |
| Interquartile 25% (IQ1) | $43,354 | $58,322 |
| Interquartile 75% (IQ3) | $59,095 | $85,553 |
| Interquartile Range (IQR) | $15,741 | $27,231 |
| Standard Deviation (Sample) | $16,937 | $38,798 |
| Standard Deviation (Population) | $16,734 | $38,310 |
Similar Demographics by Householder Income Over 65 years
Demographics Similar to Immigrants from Dominica by Householder Income Over 65 years
In terms of householder income over 65 years, the demographic groups most similar to Immigrants from Dominica are Cape Verdean ($50,077, a difference of 0.010%), Dutch West Indian ($50,475, a difference of 0.81%), Pima ($50,539, a difference of 0.93%), Immigrants from Grenada ($50,747, a difference of 1.3%), and Black/African American ($50,779, a difference of 1.4%).
| Demographics | Rating | Rank | Householder Income Over 65 years |
| Bahamians | 0.0 /100 | #327 | Tragic $51,000 |
| Hopi | 0.0 /100 | #328 | Tragic $50,925 |
| Blacks/African Americans | 0.0 /100 | #329 | Tragic $50,779 |
| Immigrants | Grenada | 0.0 /100 | #330 | Tragic $50,747 |
| Pima | 0.0 /100 | #331 | Tragic $50,539 |
| Dutch West Indians | 0.0 /100 | #332 | Tragic $50,475 |
| Cape Verdeans | 0.0 /100 | #333 | Tragic $50,077 |
| Immigrants | Dominica | 0.0 /100 | #334 | Tragic $50,071 |
| Crow | 0.0 /100 | #335 | Tragic $49,234 |
| Cubans | 0.0 /100 | #336 | Tragic $49,152 |
| Tohono O'odham | 0.0 /100 | #337 | Tragic $49,121 |
| Immigrants | Caribbean | 0.0 /100 | #338 | Tragic $48,535 |
| Navajo | 0.0 /100 | #339 | Tragic $47,722 |
| Immigrants | Yemen | 0.0 /100 | #340 | Tragic $47,527 |
| Dominicans | 0.0 /100 | #341 | Tragic $46,964 |
Demographics Similar to New Zealanders by Householder Income Over 65 years
In terms of householder income over 65 years, the demographic groups most similar to New Zealanders are Latvian ($67,326, a difference of 0.010%), Immigrants from South Africa ($67,234, a difference of 0.15%), Korean ($67,472, a difference of 0.21%), Immigrants from Asia ($67,594, a difference of 0.39%), and Russian ($67,626, a difference of 0.44%).
| Demographics | Rating | Rank | Householder Income Over 65 years |
| Tongans | 100.0 /100 | #35 | Exceptional $68,235 |
| Immigrants | Austria | 99.9 /100 | #36 | Exceptional $68,208 |
| Turks | 99.9 /100 | #37 | Exceptional $68,037 |
| Estonians | 99.9 /100 | #38 | Exceptional $67,926 |
| Russians | 99.9 /100 | #39 | Exceptional $67,626 |
| Immigrants | Asia | 99.9 /100 | #40 | Exceptional $67,594 |
| Koreans | 99.9 /100 | #41 | Exceptional $67,472 |
| New Zealanders | 99.9 /100 | #42 | Exceptional $67,333 |
| Latvians | 99.9 /100 | #43 | Exceptional $67,326 |
| Immigrants | South Africa | 99.9 /100 | #44 | Exceptional $67,234 |
| Immigrants | Afghanistan | 99.8 /100 | #45 | Exceptional $67,007 |
| Cambodians | 99.8 /100 | #46 | Exceptional $66,892 |
| Australians | 99.8 /100 | #47 | Exceptional $66,891 |
| Immigrants | France | 99.8 /100 | #48 | Exceptional $66,826 |
| Immigrants | Indonesia | 99.8 /100 | #49 | Exceptional $66,694 |