Immigrants from Israel vs New Zealander Householder Income Over 65 years
COMPARE
Immigrants from Israel
New Zealander
Householder Income Over 65 years
Householder Income Over 65 years Comparison
Immigrants from Israel
New Zealanders
$69,857
HOUSEHOLDER INCOME OVER 65 YEARS
100.0/ 100
METRIC RATING
22nd/ 347
METRIC RANK
$67,333
HOUSEHOLDER INCOME OVER 65 YEARS
99.9/ 100
METRIC RATING
42nd/ 347
METRIC RANK
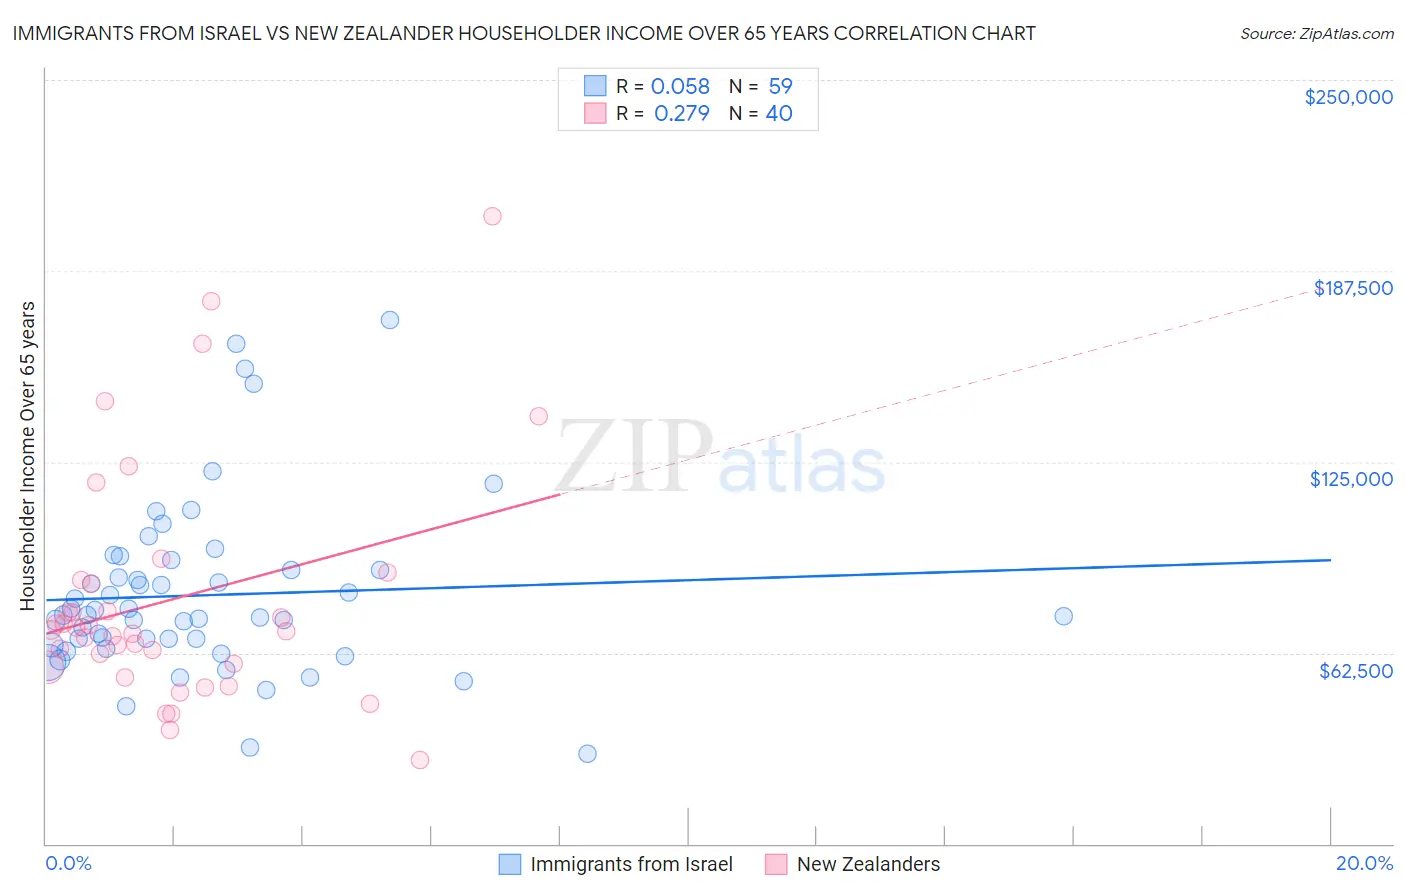
Immigrants from Israel vs New Zealander Householder Income Over 65 years Correlation Chart
The statistical analysis conducted on geographies consisting of 209,649,520 people shows a slight positive correlation between the proportion of Immigrants from Israel and household income with householder over the age of 65 in the United States with a correlation coefficient (R) of 0.058 and weighted average of $69,857. Similarly, the statistical analysis conducted on geographies consisting of 106,796,151 people shows a weak positive correlation between the proportion of New Zealanders and household income with householder over the age of 65 in the United States with a correlation coefficient (R) of 0.279 and weighted average of $67,333, a difference of 3.7%.
Householder Income Over 65 years Correlation Summary
| Measurement | Immigrants from Israel | New Zealander |
| Minimum | $29,457 | $27,419 |
| Maximum | $171,563 | $205,469 |
| Range | $142,106 | $178,050 |
| Mean | $81,354 | $79,932 |
| Median | $74,737 | $69,710 |
| Interquartile 25% (IQ1) | $65,166 | $58,322 |
| Interquartile 75% (IQ3) | $89,688 | $85,553 |
| Interquartile Range (IQR) | $24,522 | $27,231 |
| Standard Deviation (Sample) | $28,278 | $38,798 |
| Standard Deviation (Population) | $28,038 | $38,310 |
Demographics Similar to Immigrants from Israel and New Zealanders by Householder Income Over 65 years
In terms of householder income over 65 years, the demographic groups most similar to Immigrants from Israel are Immigrants from Japan ($69,774, a difference of 0.12%), Immigrants from Sweden ($69,722, a difference of 0.19%), Immigrants from Belgium ($69,703, a difference of 0.22%), Immigrants from Sri Lanka ($69,426, a difference of 0.62%), and Immigrants from Switzerland ($69,343, a difference of 0.74%). Similarly, the demographic groups most similar to New Zealanders are Korean ($67,472, a difference of 0.21%), Immigrants from Asia ($67,594, a difference of 0.39%), Russian ($67,626, a difference of 0.44%), Estonian ($67,926, a difference of 0.88%), and Turkish ($68,037, a difference of 1.1%).
| Demographics | Rating | Rank | Householder Income Over 65 years |
| Immigrants | Israel | 100.0 /100 | #22 | Exceptional $69,857 |
| Immigrants | Japan | 100.0 /100 | #23 | Exceptional $69,774 |
| Immigrants | Sweden | 100.0 /100 | #24 | Exceptional $69,722 |
| Immigrants | Belgium | 100.0 /100 | #25 | Exceptional $69,703 |
| Immigrants | Sri Lanka | 100.0 /100 | #26 | Exceptional $69,426 |
| Immigrants | Switzerland | 100.0 /100 | #27 | Exceptional $69,343 |
| Immigrants | China | 100.0 /100 | #28 | Exceptional $69,174 |
| Immigrants | Australia | 100.0 /100 | #29 | Exceptional $69,164 |
| Immigrants | Northern Europe | 100.0 /100 | #30 | Exceptional $69,003 |
| Afghans | 100.0 /100 | #31 | Exceptional $68,951 |
| Asians | 100.0 /100 | #32 | Exceptional $68,822 |
| Immigrants | Denmark | 100.0 /100 | #33 | Exceptional $68,801 |
| Immigrants | Ireland | 100.0 /100 | #34 | Exceptional $68,495 |
| Tongans | 100.0 /100 | #35 | Exceptional $68,235 |
| Immigrants | Austria | 99.9 /100 | #36 | Exceptional $68,208 |
| Turks | 99.9 /100 | #37 | Exceptional $68,037 |
| Estonians | 99.9 /100 | #38 | Exceptional $67,926 |
| Russians | 99.9 /100 | #39 | Exceptional $67,626 |
| Immigrants | Asia | 99.9 /100 | #40 | Exceptional $67,594 |
| Koreans | 99.9 /100 | #41 | Exceptional $67,472 |
| New Zealanders | 99.9 /100 | #42 | Exceptional $67,333 |