Immigrants from St. Vincent and the Grenadines vs Spaniard Householder Income Over 65 years
COMPARE
Immigrants from St. Vincent and the Grenadines
Spaniard
Householder Income Over 65 years
Householder Income Over 65 years Comparison
Immigrants from St. Vincent and the Grenadines
Spaniards
$51,922
HOUSEHOLDER INCOME OVER 65 YEARS
0.0/ 100
METRIC RATING
317th/ 347
METRIC RANK
$60,866
HOUSEHOLDER INCOME OVER 65 YEARS
47.3/ 100
METRIC RATING
175th/ 347
METRIC RANK
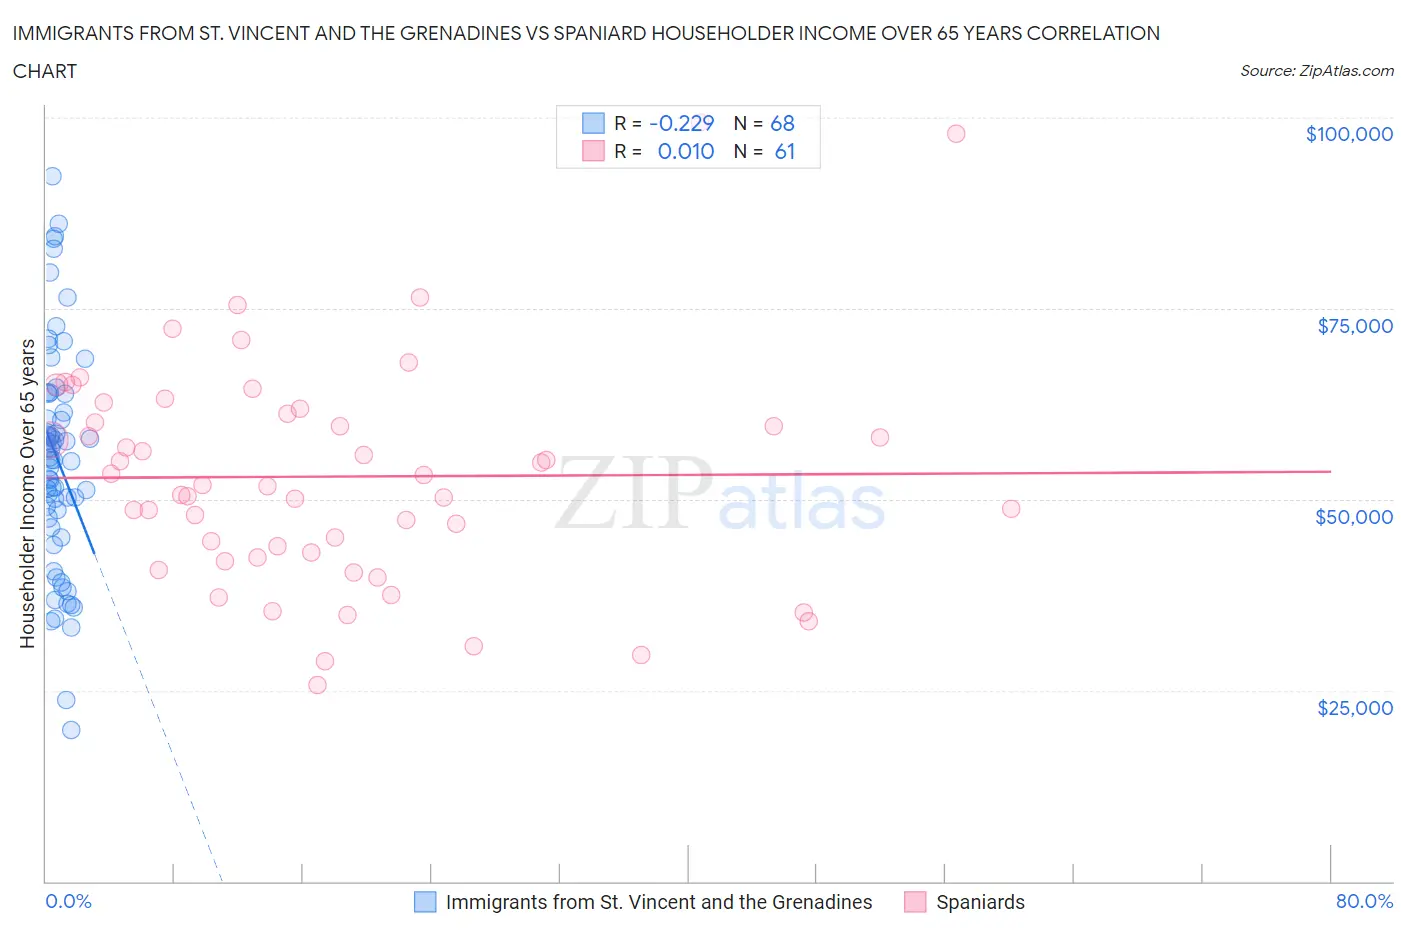
Immigrants from St. Vincent and the Grenadines vs Spaniard Householder Income Over 65 years Correlation Chart
The statistical analysis conducted on geographies consisting of 56,083,618 people shows a weak negative correlation between the proportion of Immigrants from St. Vincent and the Grenadines and household income with householder over the age of 65 in the United States with a correlation coefficient (R) of -0.229 and weighted average of $51,922. Similarly, the statistical analysis conducted on geographies consisting of 441,402,444 people shows no correlation between the proportion of Spaniards and household income with householder over the age of 65 in the United States with a correlation coefficient (R) of 0.010 and weighted average of $60,866, a difference of 17.2%.
Householder Income Over 65 years Correlation Summary
| Measurement | Immigrants from St. Vincent and the Grenadines | Spaniard |
| Minimum | $19,854 | $25,625 |
| Maximum | $92,344 | $99,316 |
| Range | $72,490 | $73,691 |
| Mean | $55,268 | $52,982 |
| Median | $55,309 | $51,848 |
| Interquartile 25% (IQ1) | $46,915 | $42,711 |
| Interquartile 75% (IQ3) | $63,847 | $61,532 |
| Interquartile Range (IQR) | $16,932 | $18,821 |
| Standard Deviation (Sample) | $14,822 | $14,647 |
| Standard Deviation (Population) | $14,713 | $14,526 |
Similar Demographics by Householder Income Over 65 years
Demographics Similar to Immigrants from St. Vincent and the Grenadines by Householder Income Over 65 years
In terms of householder income over 65 years, the demographic groups most similar to Immigrants from St. Vincent and the Grenadines are Haitian ($51,912, a difference of 0.020%), Creek ($51,949, a difference of 0.050%), Immigrants from Honduras ($51,888, a difference of 0.070%), U.S. Virgin Islander ($52,072, a difference of 0.29%), and Native/Alaskan ($52,081, a difference of 0.30%).
| Demographics | Rating | Rank | Householder Income Over 65 years |
| Sioux | 0.0 /100 | #310 | Tragic $52,509 |
| Seminole | 0.0 /100 | #311 | Tragic $52,373 |
| Immigrants | Azores | 0.0 /100 | #312 | Tragic $52,121 |
| Immigrants | Nicaragua | 0.0 /100 | #313 | Tragic $52,085 |
| Natives/Alaskans | 0.0 /100 | #314 | Tragic $52,081 |
| U.S. Virgin Islanders | 0.0 /100 | #315 | Tragic $52,072 |
| Creek | 0.0 /100 | #316 | Tragic $51,949 |
| Immigrants | St. Vincent and the Grenadines | 0.0 /100 | #317 | Tragic $51,922 |
| Haitians | 0.0 /100 | #318 | Tragic $51,912 |
| Immigrants | Honduras | 0.0 /100 | #319 | Tragic $51,888 |
| Colville | 0.0 /100 | #320 | Tragic $51,739 |
| Menominee | 0.0 /100 | #321 | Tragic $51,719 |
| British West Indians | 0.0 /100 | #322 | Tragic $51,463 |
| Cajuns | 0.0 /100 | #323 | Tragic $51,397 |
| Immigrants | Congo | 0.0 /100 | #324 | Tragic $51,393 |
Demographics Similar to Spaniards by Householder Income Over 65 years
In terms of householder income over 65 years, the demographic groups most similar to Spaniards are Spanish ($60,795, a difference of 0.12%), Luxembourger ($60,967, a difference of 0.17%), Alaska Native ($60,748, a difference of 0.19%), Immigrants from Micronesia ($61,000, a difference of 0.22%), and Yup'ik ($60,727, a difference of 0.23%).
| Demographics | Rating | Rank | Householder Income Over 65 years |
| Irish | 53.4 /100 | #168 | Average $61,097 |
| Carpatho Rusyns | 53.3 /100 | #169 | Average $61,093 |
| Serbians | 53.1 /100 | #170 | Average $61,087 |
| Inupiat | 52.4 /100 | #171 | Average $61,061 |
| Immigrants | Poland | 51.9 /100 | #172 | Average $61,041 |
| Immigrants | Micronesia | 50.8 /100 | #173 | Average $61,000 |
| Luxembourgers | 50.0 /100 | #174 | Average $60,967 |
| Spaniards | 47.3 /100 | #175 | Average $60,866 |
| Spanish | 45.5 /100 | #176 | Average $60,795 |
| Alaska Natives | 44.3 /100 | #177 | Average $60,748 |
| Yup'ik | 43.7 /100 | #178 | Average $60,727 |
| Welsh | 42.2 /100 | #179 | Average $60,666 |
| Immigrants | Morocco | 41.7 /100 | #180 | Average $60,647 |
| Celtics | 40.7 /100 | #181 | Average $60,608 |
| Czechoslovakians | 40.0 /100 | #182 | Average $60,581 |