Immigrants from St. Vincent and the Grenadines vs Immigrants from Bulgaria Householder Income Ages 45 - 64 years
COMPARE
Immigrants from St. Vincent and the Grenadines
Immigrants from Bulgaria
Householder Income Ages 45 - 64 years
Householder Income Ages 45 - 64 years Comparison
Immigrants from St. Vincent and the Grenadines
Immigrants from Bulgaria
$86,394
HOUSEHOLDER INCOME AGES 45 - 64 YEARS
0.1/ 100
METRIC RATING
288th/ 347
METRIC RANK
$109,379
HOUSEHOLDER INCOME AGES 45 - 64 YEARS
98.9/ 100
METRIC RATING
79th/ 347
METRIC RANK
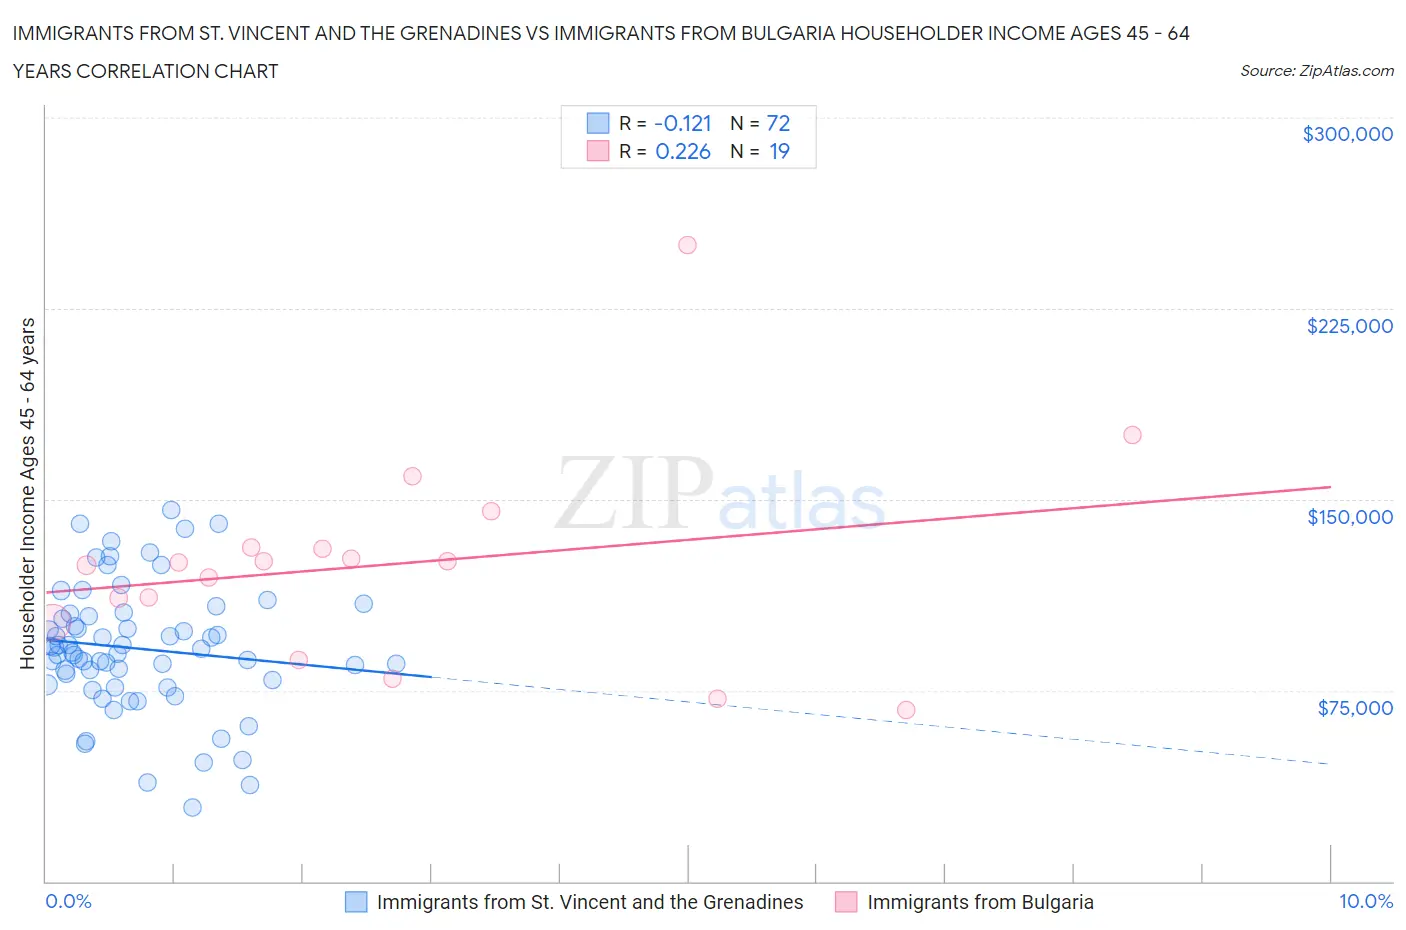
Immigrants from St. Vincent and the Grenadines vs Immigrants from Bulgaria Householder Income Ages 45 - 64 years Correlation Chart
The statistical analysis conducted on geographies consisting of 56,172,416 people shows a poor negative correlation between the proportion of Immigrants from St. Vincent and the Grenadines and household income with householder between the ages 45 and 64 in the United States with a correlation coefficient (R) of -0.121 and weighted average of $86,394. Similarly, the statistical analysis conducted on geographies consisting of 172,506,403 people shows a weak positive correlation between the proportion of Immigrants from Bulgaria and household income with householder between the ages 45 and 64 in the United States with a correlation coefficient (R) of 0.226 and weighted average of $109,379, a difference of 26.6%.
Householder Income Ages 45 - 64 years Correlation Summary
| Measurement | Immigrants from St. Vincent and the Grenadines | Immigrants from Bulgaria |
| Minimum | $29,032 | $67,188 |
| Maximum | $145,625 | $250,001 |
| Range | $116,593 | $182,813 |
| Mean | $91,362 | $124,619 |
| Median | $90,616 | $125,429 |
| Interquartile 25% (IQ1) | $78,013 | $101,725 |
| Interquartile 75% (IQ3) | $104,689 | $131,294 |
| Interquartile Range (IQR) | $26,677 | $29,569 |
| Standard Deviation (Sample) | $24,861 | $41,151 |
| Standard Deviation (Population) | $24,688 | $40,053 |
Similar Demographics by Householder Income Ages 45 - 64 years
Demographics Similar to Immigrants from St. Vincent and the Grenadines by Householder Income Ages 45 - 64 years
In terms of householder income ages 45 - 64 years, the demographic groups most similar to Immigrants from St. Vincent and the Grenadines are Bangladeshi ($86,402, a difference of 0.010%), Cuban ($86,301, a difference of 0.11%), Immigrants from Guatemala ($86,573, a difference of 0.21%), Blackfeet ($86,595, a difference of 0.23%), and Cherokee ($86,125, a difference of 0.31%).
| Demographics | Rating | Rank | Householder Income Ages 45 - 64 years |
| Yaqui | 0.1 /100 | #281 | Tragic $86,914 |
| Senegalese | 0.1 /100 | #282 | Tragic $86,897 |
| Mexicans | 0.1 /100 | #283 | Tragic $86,816 |
| Central American Indians | 0.1 /100 | #284 | Tragic $86,764 |
| Blackfeet | 0.1 /100 | #285 | Tragic $86,595 |
| Immigrants | Guatemala | 0.1 /100 | #286 | Tragic $86,573 |
| Bangladeshis | 0.1 /100 | #287 | Tragic $86,402 |
| Immigrants | St. Vincent and the Grenadines | 0.1 /100 | #288 | Tragic $86,394 |
| Cubans | 0.1 /100 | #289 | Tragic $86,301 |
| Cherokee | 0.1 /100 | #290 | Tragic $86,125 |
| Hispanics or Latinos | 0.1 /100 | #291 | Tragic $86,006 |
| Immigrants | Central America | 0.1 /100 | #292 | Tragic $85,965 |
| Comanche | 0.1 /100 | #293 | Tragic $85,787 |
| British West Indians | 0.1 /100 | #294 | Tragic $85,571 |
| Immigrants | Grenada | 0.1 /100 | #295 | Tragic $85,552 |
Demographics Similar to Immigrants from Bulgaria by Householder Income Ages 45 - 64 years
In terms of householder income ages 45 - 64 years, the demographic groups most similar to Immigrants from Bulgaria are Jordanian ($109,376, a difference of 0.0%), Immigrants from Canada ($109,402, a difference of 0.020%), Immigrants from Eastern Europe ($109,335, a difference of 0.040%), Paraguayan ($109,447, a difference of 0.060%), and Immigrants from England ($109,446, a difference of 0.060%).
| Demographics | Rating | Rank | Householder Income Ages 45 - 64 years |
| Assyrians/Chaldeans/Syriacs | 99.3 /100 | #72 | Exceptional $110,201 |
| Argentineans | 99.3 /100 | #73 | Exceptional $110,103 |
| Immigrants | Egypt | 99.2 /100 | #74 | Exceptional $109,941 |
| South Africans | 99.1 /100 | #75 | Exceptional $109,719 |
| Paraguayans | 99.0 /100 | #76 | Exceptional $109,447 |
| Immigrants | England | 99.0 /100 | #77 | Exceptional $109,446 |
| Immigrants | Canada | 99.0 /100 | #78 | Exceptional $109,402 |
| Immigrants | Bulgaria | 98.9 /100 | #79 | Exceptional $109,379 |
| Jordanians | 98.9 /100 | #80 | Exceptional $109,376 |
| Immigrants | Eastern Europe | 98.9 /100 | #81 | Exceptional $109,335 |
| Immigrants | North America | 98.8 /100 | #82 | Exceptional $109,198 |
| Immigrants | Spain | 98.8 /100 | #83 | Exceptional $109,051 |
| Immigrants | Western Europe | 98.6 /100 | #84 | Exceptional $108,824 |
| Immigrants | Afghanistan | 98.6 /100 | #85 | Exceptional $108,785 |
| Austrians | 98.5 /100 | #86 | Exceptional $108,692 |