Immigrants from St. Vincent and the Grenadines vs Cree Householder Income Ages 45 - 64 years
COMPARE
Immigrants from St. Vincent and the Grenadines
Cree
Householder Income Ages 45 - 64 years
Householder Income Ages 45 - 64 years Comparison
Immigrants from St. Vincent and the Grenadines
Cree
$86,394
HOUSEHOLDER INCOME AGES 45 - 64 YEARS
0.1/ 100
METRIC RATING
288th/ 347
METRIC RANK
$87,185
HOUSEHOLDER INCOME AGES 45 - 64 YEARS
0.1/ 100
METRIC RATING
277th/ 347
METRIC RANK
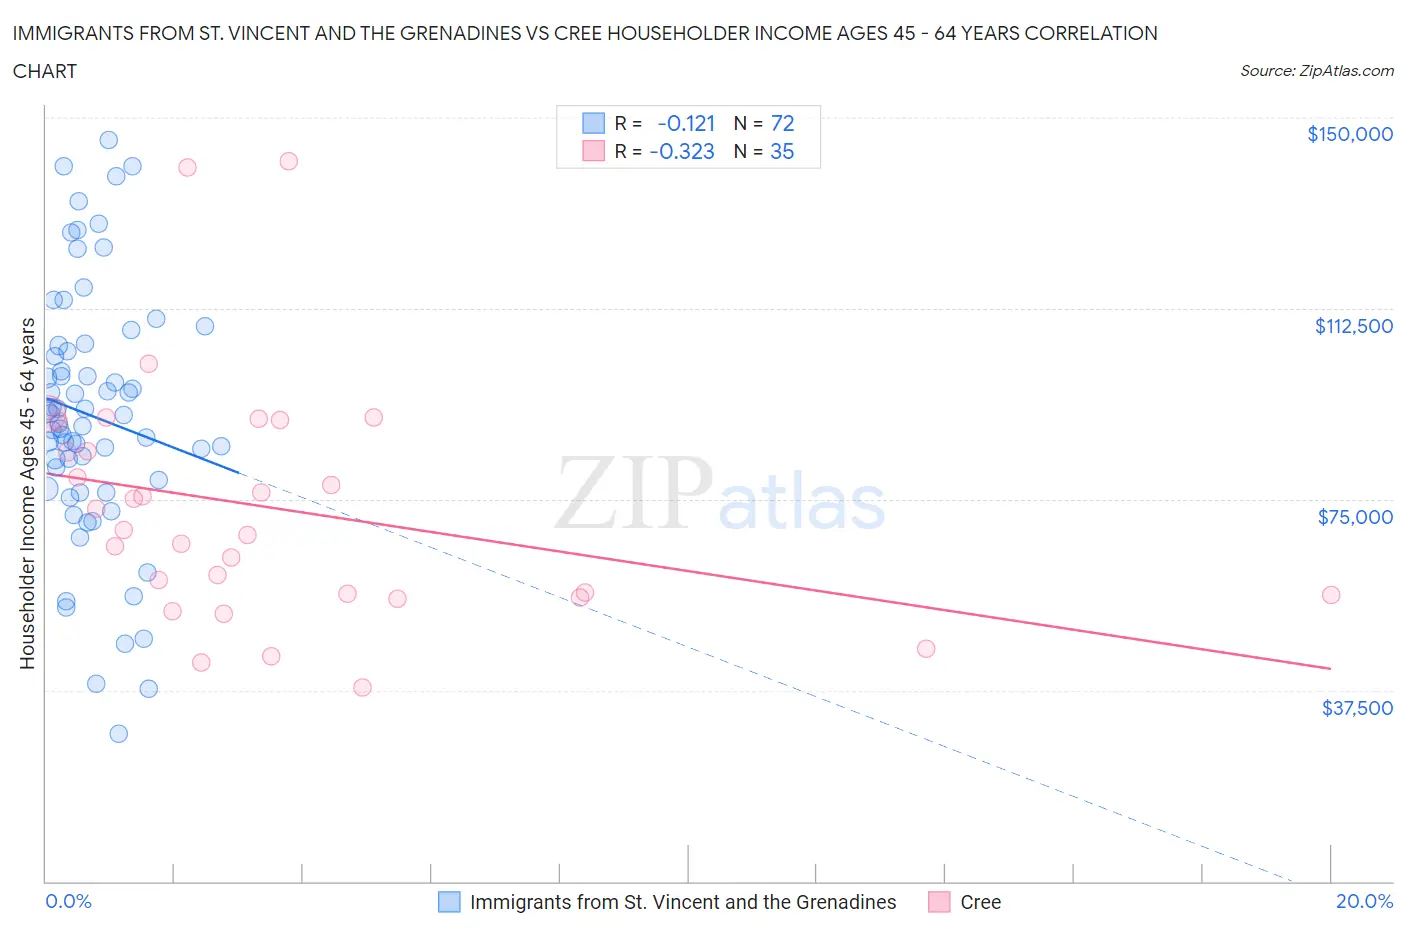
Immigrants from St. Vincent and the Grenadines vs Cree Householder Income Ages 45 - 64 years Correlation Chart
The statistical analysis conducted on geographies consisting of 56,172,416 people shows a poor negative correlation between the proportion of Immigrants from St. Vincent and the Grenadines and household income with householder between the ages 45 and 64 in the United States with a correlation coefficient (R) of -0.121 and weighted average of $86,394. Similarly, the statistical analysis conducted on geographies consisting of 76,173,826 people shows a mild negative correlation between the proportion of Cree and household income with householder between the ages 45 and 64 in the United States with a correlation coefficient (R) of -0.323 and weighted average of $87,185, a difference of 0.92%.
Householder Income Ages 45 - 64 years Correlation Summary
| Measurement | Immigrants from St. Vincent and the Grenadines | Cree |
| Minimum | $29,032 | $38,125 |
| Maximum | $145,625 | $141,447 |
| Range | $116,593 | $103,322 |
| Mean | $91,362 | $73,266 |
| Median | $90,616 | $69,060 |
| Interquartile 25% (IQ1) | $78,013 | $56,250 |
| Interquartile 75% (IQ3) | $104,689 | $90,223 |
| Interquartile Range (IQR) | $26,677 | $33,973 |
| Standard Deviation (Sample) | $24,861 | $23,520 |
| Standard Deviation (Population) | $24,688 | $23,182 |
Demographics Similar to Immigrants from St. Vincent and the Grenadines and Cree by Householder Income Ages 45 - 64 years
In terms of householder income ages 45 - 64 years, the demographic groups most similar to Immigrants from St. Vincent and the Grenadines are Bangladeshi ($86,402, a difference of 0.010%), Cuban ($86,301, a difference of 0.11%), Immigrants from Guatemala ($86,573, a difference of 0.21%), Blackfeet ($86,595, a difference of 0.23%), and Cherokee ($86,125, a difference of 0.31%). Similarly, the demographic groups most similar to Cree are Immigrants from Latin America ($87,219, a difference of 0.040%), Immigrants from Belize ($87,229, a difference of 0.050%), Iroquois ($87,255, a difference of 0.080%), Immigrants from Jamaica ($87,035, a difference of 0.17%), and Yakama ($86,992, a difference of 0.22%).
| Demographics | Rating | Rank | Householder Income Ages 45 - 64 years |
| Cape Verdeans | 0.2 /100 | #272 | Tragic $87,580 |
| Spanish American Indians | 0.2 /100 | #273 | Tragic $87,561 |
| Iroquois | 0.1 /100 | #274 | Tragic $87,255 |
| Immigrants | Belize | 0.1 /100 | #275 | Tragic $87,229 |
| Immigrants | Latin America | 0.1 /100 | #276 | Tragic $87,219 |
| Cree | 0.1 /100 | #277 | Tragic $87,185 |
| Immigrants | Jamaica | 0.1 /100 | #278 | Tragic $87,035 |
| Yakama | 0.1 /100 | #279 | Tragic $86,992 |
| Immigrants | Somalia | 0.1 /100 | #280 | Tragic $86,987 |
| Yaqui | 0.1 /100 | #281 | Tragic $86,914 |
| Senegalese | 0.1 /100 | #282 | Tragic $86,897 |
| Mexicans | 0.1 /100 | #283 | Tragic $86,816 |
| Central American Indians | 0.1 /100 | #284 | Tragic $86,764 |
| Blackfeet | 0.1 /100 | #285 | Tragic $86,595 |
| Immigrants | Guatemala | 0.1 /100 | #286 | Tragic $86,573 |
| Bangladeshis | 0.1 /100 | #287 | Tragic $86,402 |
| Immigrants | St. Vincent and the Grenadines | 0.1 /100 | #288 | Tragic $86,394 |
| Cubans | 0.1 /100 | #289 | Tragic $86,301 |
| Cherokee | 0.1 /100 | #290 | Tragic $86,125 |
| Hispanics or Latinos | 0.1 /100 | #291 | Tragic $86,006 |
| Immigrants | Central America | 0.1 /100 | #292 | Tragic $85,965 |