Immigrants from St. Vincent and the Grenadines vs Apache Householder Income Ages 45 - 64 years
COMPARE
Immigrants from St. Vincent and the Grenadines
Apache
Householder Income Ages 45 - 64 years
Householder Income Ages 45 - 64 years Comparison
Immigrants from St. Vincent and the Grenadines
Apache
$86,394
HOUSEHOLDER INCOME AGES 45 - 64 YEARS
0.1/ 100
METRIC RATING
288th/ 347
METRIC RANK
$82,184
HOUSEHOLDER INCOME AGES 45 - 64 YEARS
0.0/ 100
METRIC RATING
320th/ 347
METRIC RANK
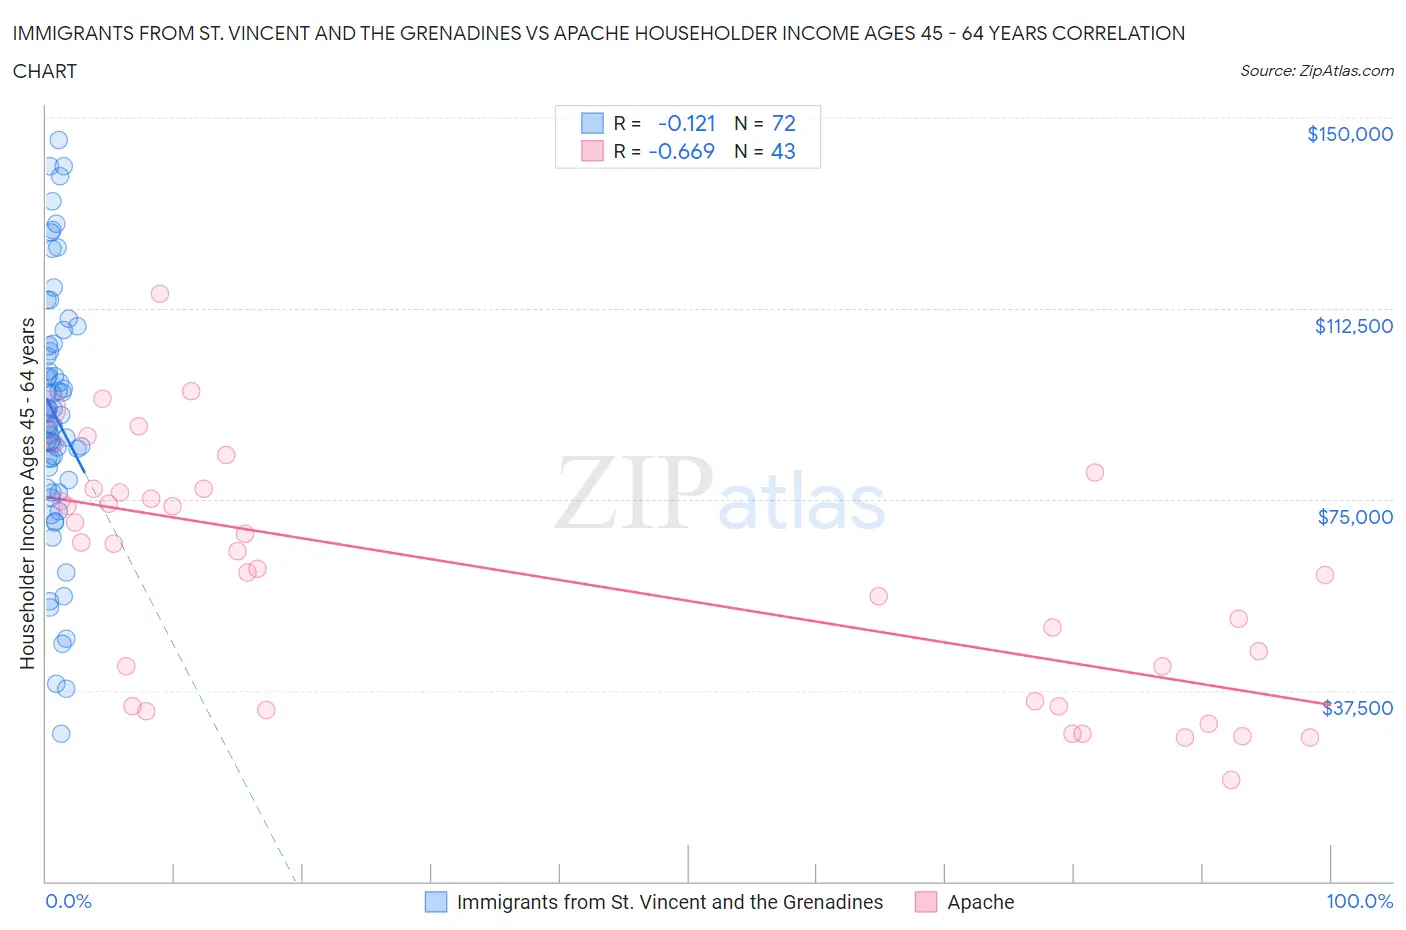
Immigrants from St. Vincent and the Grenadines vs Apache Householder Income Ages 45 - 64 years Correlation Chart
The statistical analysis conducted on geographies consisting of 56,172,416 people shows a poor negative correlation between the proportion of Immigrants from St. Vincent and the Grenadines and household income with householder between the ages 45 and 64 in the United States with a correlation coefficient (R) of -0.121 and weighted average of $86,394. Similarly, the statistical analysis conducted on geographies consisting of 230,746,916 people shows a significant negative correlation between the proportion of Apache and household income with householder between the ages 45 and 64 in the United States with a correlation coefficient (R) of -0.669 and weighted average of $82,184, a difference of 5.1%.
Householder Income Ages 45 - 64 years Correlation Summary
| Measurement | Immigrants from St. Vincent and the Grenadines | Apache |
| Minimum | $29,032 | $19,917 |
| Maximum | $145,625 | $115,357 |
| Range | $116,593 | $95,440 |
| Mean | $91,362 | $60,429 |
| Median | $90,616 | $64,821 |
| Interquartile 25% (IQ1) | $78,013 | $34,492 |
| Interquartile 75% (IQ3) | $104,689 | $77,043 |
| Interquartile Range (IQR) | $26,677 | $42,551 |
| Standard Deviation (Sample) | $24,861 | $23,821 |
| Standard Deviation (Population) | $24,688 | $23,542 |
Similar Demographics by Householder Income Ages 45 - 64 years
Demographics Similar to Immigrants from St. Vincent and the Grenadines by Householder Income Ages 45 - 64 years
In terms of householder income ages 45 - 64 years, the demographic groups most similar to Immigrants from St. Vincent and the Grenadines are Bangladeshi ($86,402, a difference of 0.010%), Cuban ($86,301, a difference of 0.11%), Immigrants from Guatemala ($86,573, a difference of 0.21%), Blackfeet ($86,595, a difference of 0.23%), and Cherokee ($86,125, a difference of 0.31%).
| Demographics | Rating | Rank | Householder Income Ages 45 - 64 years |
| Yaqui | 0.1 /100 | #281 | Tragic $86,914 |
| Senegalese | 0.1 /100 | #282 | Tragic $86,897 |
| Mexicans | 0.1 /100 | #283 | Tragic $86,816 |
| Central American Indians | 0.1 /100 | #284 | Tragic $86,764 |
| Blackfeet | 0.1 /100 | #285 | Tragic $86,595 |
| Immigrants | Guatemala | 0.1 /100 | #286 | Tragic $86,573 |
| Bangladeshis | 0.1 /100 | #287 | Tragic $86,402 |
| Immigrants | St. Vincent and the Grenadines | 0.1 /100 | #288 | Tragic $86,394 |
| Cubans | 0.1 /100 | #289 | Tragic $86,301 |
| Cherokee | 0.1 /100 | #290 | Tragic $86,125 |
| Hispanics or Latinos | 0.1 /100 | #291 | Tragic $86,006 |
| Immigrants | Central America | 0.1 /100 | #292 | Tragic $85,965 |
| Comanche | 0.1 /100 | #293 | Tragic $85,787 |
| British West Indians | 0.1 /100 | #294 | Tragic $85,571 |
| Immigrants | Grenada | 0.1 /100 | #295 | Tragic $85,552 |
Demographics Similar to Apache by Householder Income Ages 45 - 64 years
In terms of householder income ages 45 - 64 years, the demographic groups most similar to Apache are Chickasaw ($82,193, a difference of 0.010%), Yuman ($82,139, a difference of 0.050%), Choctaw ($82,287, a difference of 0.13%), Colville ($82,474, a difference of 0.35%), and Immigrants from Caribbean ($82,513, a difference of 0.40%).
| Demographics | Rating | Rank | Householder Income Ages 45 - 64 years |
| U.S. Virgin Islanders | 0.0 /100 | #313 | Tragic $82,736 |
| Immigrants | Honduras | 0.0 /100 | #314 | Tragic $82,697 |
| Paiute | 0.0 /100 | #315 | Tragic $82,629 |
| Immigrants | Caribbean | 0.0 /100 | #316 | Tragic $82,513 |
| Colville | 0.0 /100 | #317 | Tragic $82,474 |
| Choctaw | 0.0 /100 | #318 | Tragic $82,287 |
| Chickasaw | 0.0 /100 | #319 | Tragic $82,193 |
| Apache | 0.0 /100 | #320 | Tragic $82,184 |
| Yuman | 0.0 /100 | #321 | Tragic $82,139 |
| Sioux | 0.0 /100 | #322 | Tragic $81,750 |
| Bahamians | 0.0 /100 | #323 | Tragic $81,369 |
| Yup'ik | 0.0 /100 | #324 | Tragic $81,000 |
| Immigrants | Cuba | 0.0 /100 | #325 | Tragic $80,662 |
| Dominicans | 0.0 /100 | #326 | Tragic $80,623 |
| Seminole | 0.0 /100 | #327 | Tragic $80,077 |