Immigrants from St. Vincent and the Grenadines vs Immigrants from Israel Professional Degree
COMPARE
Immigrants from St. Vincent and the Grenadines
Immigrants from Israel
Professional Degree
Professional Degree Comparison
Immigrants from St. Vincent and the Grenadines
Immigrants from Israel
3.7%
PROFESSIONAL DEGREE
1.1/ 100
METRIC RATING
258th/ 347
METRIC RANK
7.9%
PROFESSIONAL DEGREE
100.0/ 100
METRIC RATING
1st/ 347
METRIC RANK
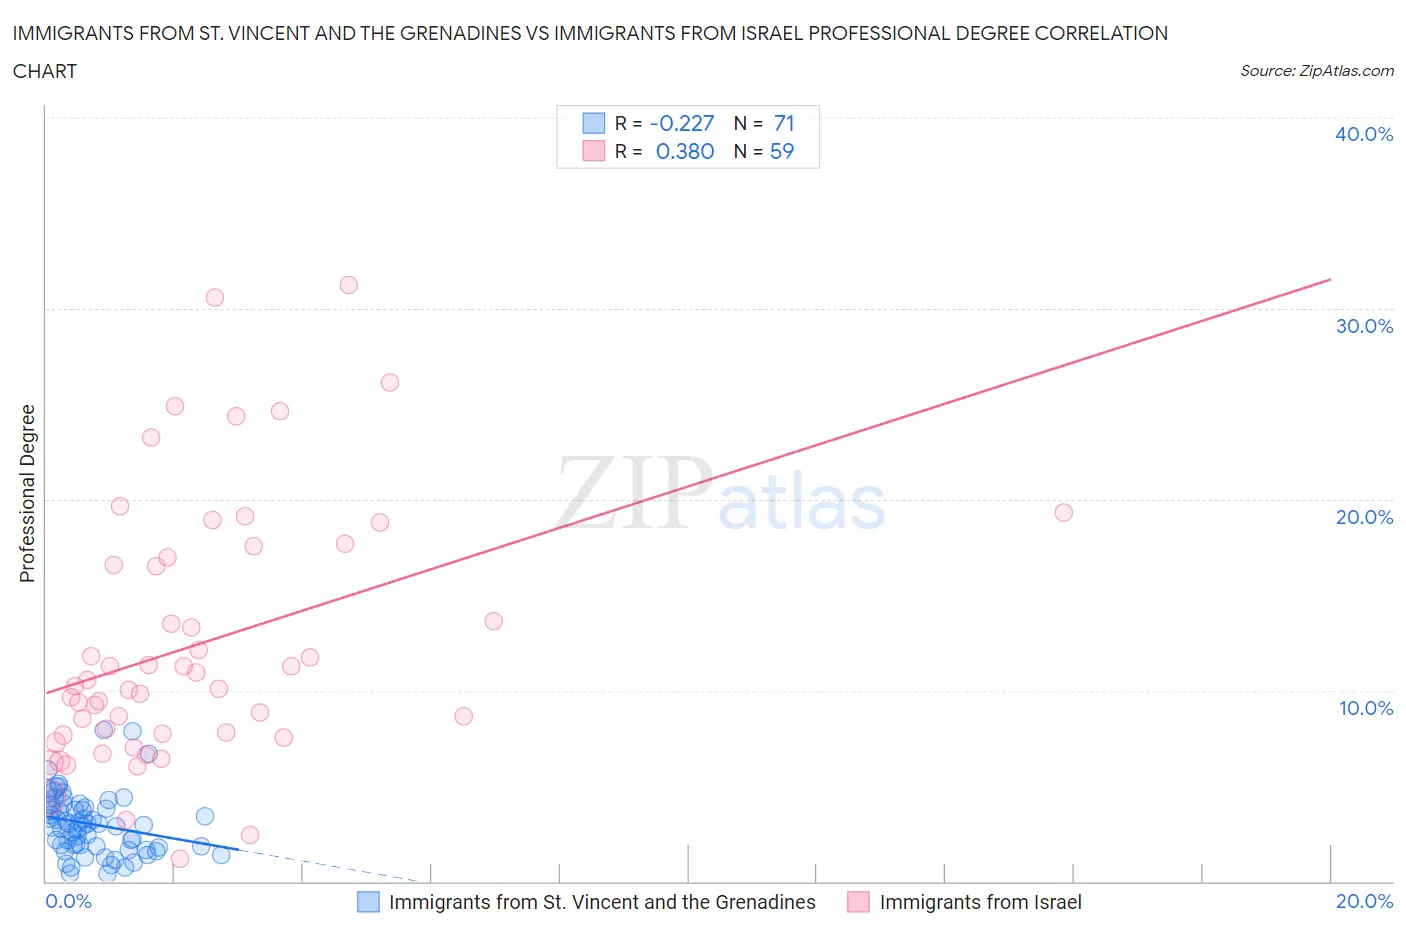
Immigrants from St. Vincent and the Grenadines vs Immigrants from Israel Professional Degree Correlation Chart
The statistical analysis conducted on geographies consisting of 56,174,438 people shows a weak negative correlation between the proportion of Immigrants from St. Vincent and the Grenadines and percentage of population with at least professional degree education in the United States with a correlation coefficient (R) of -0.227 and weighted average of 3.7%. Similarly, the statistical analysis conducted on geographies consisting of 209,922,622 people shows a mild positive correlation between the proportion of Immigrants from Israel and percentage of population with at least professional degree education in the United States with a correlation coefficient (R) of 0.380 and weighted average of 7.9%, a difference of 113.5%.
Professional Degree Correlation Summary
| Measurement | Immigrants from St. Vincent and the Grenadines | Immigrants from Israel |
| Minimum | 0.38% | 1.2% |
| Maximum | 7.9% | 31.2% |
| Range | 7.6% | 30.0% |
| Mean | 3.0% | 12.4% |
| Median | 3.0% | 10.2% |
| Interquartile 25% (IQ1) | 1.8% | 7.6% |
| Interquartile 75% (IQ3) | 4.0% | 17.0% |
| Interquartile Range (IQR) | 2.2% | 9.3% |
| Standard Deviation (Sample) | 1.6% | 6.8% |
| Standard Deviation (Population) | 1.6% | 6.8% |
Similar Demographics by Professional Degree
Demographics Similar to Immigrants from St. Vincent and the Grenadines by Professional Degree
In terms of professional degree, the demographic groups most similar to Immigrants from St. Vincent and the Grenadines are Bahamian (3.7%, a difference of 0.080%), African (3.7%, a difference of 0.22%), Indonesian (3.7%, a difference of 0.23%), Immigrants from Guyana (3.7%, a difference of 0.41%), and U.S. Virgin Islander (3.7%, a difference of 0.42%).
| Demographics | Rating | Rank | Professional Degree |
| Immigrants | Nicaragua | 1.4 /100 | #251 | Tragic 3.7% |
| Jamaicans | 1.4 /100 | #252 | Tragic 3.7% |
| Pueblo | 1.4 /100 | #253 | Tragic 3.7% |
| Tongans | 1.3 /100 | #254 | Tragic 3.7% |
| Osage | 1.2 /100 | #255 | Tragic 3.7% |
| Iroquois | 1.2 /100 | #256 | Tragic 3.7% |
| Bahamians | 1.1 /100 | #257 | Tragic 3.7% |
| Immigrants | St. Vincent and the Grenadines | 1.1 /100 | #258 | Tragic 3.7% |
| Africans | 1.0 /100 | #259 | Tragic 3.7% |
| Indonesians | 1.0 /100 | #260 | Tragic 3.7% |
| Immigrants | Guyana | 1.0 /100 | #261 | Tragic 3.7% |
| U.S. Virgin Islanders | 1.0 /100 | #262 | Tragic 3.7% |
| Hopi | 0.9 /100 | #263 | Tragic 3.6% |
| Immigrants | Cambodia | 0.9 /100 | #264 | Tragic 3.6% |
| Immigrants | Congo | 0.8 /100 | #265 | Tragic 3.6% |
Demographics Similar to Immigrants from Israel by Professional Degree
In terms of professional degree, the demographic groups most similar to Immigrants from Israel are Immigrants from Singapore (7.7%, a difference of 1.4%), Iranian (7.6%, a difference of 3.1%), Filipino (7.6%, a difference of 3.9%), Immigrants from Iran (7.3%, a difference of 7.2%), and Okinawan (7.3%, a difference of 7.3%).
| Demographics | Rating | Rank | Professional Degree |
| Immigrants | Israel | 100.0 /100 | #1 | Exceptional 7.9% |
| Immigrants | Singapore | 100.0 /100 | #2 | Exceptional 7.7% |
| Iranians | 100.0 /100 | #3 | Exceptional 7.6% |
| Filipinos | 100.0 /100 | #4 | Exceptional 7.6% |
| Immigrants | Iran | 100.0 /100 | #5 | Exceptional 7.3% |
| Okinawans | 100.0 /100 | #6 | Exceptional 7.3% |
| Eastern Europeans | 100.0 /100 | #7 | Exceptional 7.1% |
| Immigrants | Switzerland | 100.0 /100 | #8 | Exceptional 7.1% |
| Immigrants | Taiwan | 100.0 /100 | #9 | Exceptional 7.1% |
| Immigrants | Belgium | 100.0 /100 | #10 | Exceptional 7.0% |
| Cypriots | 100.0 /100 | #11 | Exceptional 6.9% |
| Israelis | 100.0 /100 | #12 | Exceptional 6.9% |
| Immigrants | Australia | 100.0 /100 | #13 | Exceptional 6.9% |
| Immigrants | France | 100.0 /100 | #14 | Exceptional 6.8% |
| Immigrants | China | 100.0 /100 | #15 | Exceptional 6.7% |