Immigrants from St. Vincent and the Grenadines vs Immigrants from Indonesia Median Female Earnings
COMPARE
Immigrants from St. Vincent and the Grenadines
Immigrants from Indonesia
Median Female Earnings
Median Female Earnings Comparison
Immigrants from St. Vincent and the Grenadines
Immigrants from Indonesia
$42,108
MEDIAN FEMALE EARNINGS
99.3/ 100
METRIC RATING
86th/ 347
METRIC RANK
$43,412
MEDIAN FEMALE EARNINGS
100.0/ 100
METRIC RATING
48th/ 347
METRIC RANK
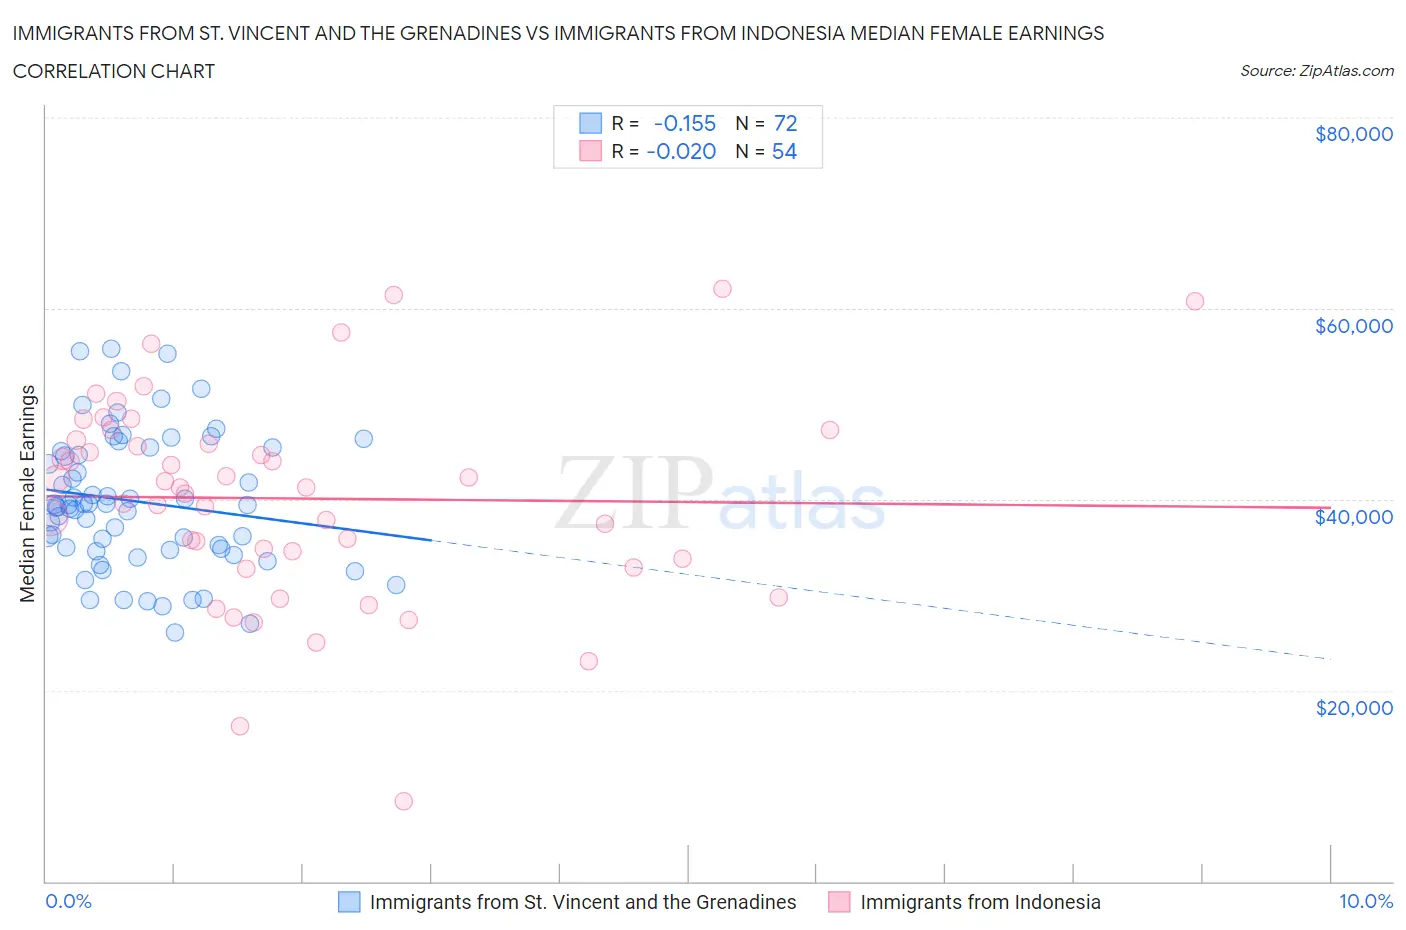
Immigrants from St. Vincent and the Grenadines vs Immigrants from Indonesia Median Female Earnings Correlation Chart
The statistical analysis conducted on geographies consisting of 56,186,609 people shows a poor negative correlation between the proportion of Immigrants from St. Vincent and the Grenadines and median female earnings in the United States with a correlation coefficient (R) of -0.155 and weighted average of $42,108. Similarly, the statistical analysis conducted on geographies consisting of 215,754,485 people shows no correlation between the proportion of Immigrants from Indonesia and median female earnings in the United States with a correlation coefficient (R) of -0.020 and weighted average of $43,412, a difference of 3.1%.
Median Female Earnings Correlation Summary
| Measurement | Immigrants from St. Vincent and the Grenadines | Immigrants from Indonesia |
| Minimum | $26,069 | $8,380 |
| Maximum | $55,714 | $62,036 |
| Range | $29,645 | $53,656 |
| Mean | $39,753 | $40,096 |
| Median | $39,381 | $41,238 |
| Interquartile 25% (IQ1) | $34,722 | $33,750 |
| Interquartile 75% (IQ3) | $45,227 | $46,213 |
| Interquartile Range (IQR) | $10,505 | $12,463 |
| Standard Deviation (Sample) | $7,078 | $10,783 |
| Standard Deviation (Population) | $7,029 | $10,682 |
Similar Demographics by Median Female Earnings
Demographics Similar to Immigrants from St. Vincent and the Grenadines by Median Female Earnings
In terms of median female earnings, the demographic groups most similar to Immigrants from St. Vincent and the Grenadines are Lithuanian ($42,108, a difference of 0.0%), Laotian ($42,133, a difference of 0.060%), Immigrants from Northern Africa ($42,084, a difference of 0.060%), Immigrants from Afghanistan ($42,055, a difference of 0.13%), and Ukrainian ($42,015, a difference of 0.22%).
| Demographics | Rating | Rank | Median Female Earnings |
| Greeks | 99.6 /100 | #79 | Exceptional $42,336 |
| Immigrants | Moldova | 99.6 /100 | #80 | Exceptional $42,304 |
| Immigrants | Southern Europe | 99.5 /100 | #81 | Exceptional $42,275 |
| Immigrants | Morocco | 99.5 /100 | #82 | Exceptional $42,229 |
| Immigrants | Sierra Leone | 99.5 /100 | #83 | Exceptional $42,214 |
| Armenians | 99.5 /100 | #84 | Exceptional $42,212 |
| Laotians | 99.4 /100 | #85 | Exceptional $42,133 |
| Immigrants | St. Vincent and the Grenadines | 99.3 /100 | #86 | Exceptional $42,108 |
| Lithuanians | 99.3 /100 | #87 | Exceptional $42,108 |
| Immigrants | Northern Africa | 99.3 /100 | #88 | Exceptional $42,084 |
| Immigrants | Afghanistan | 99.3 /100 | #89 | Exceptional $42,055 |
| Ukrainians | 99.2 /100 | #90 | Exceptional $42,015 |
| Immigrants | Western Europe | 99.2 /100 | #91 | Exceptional $41,990 |
| Argentineans | 99.1 /100 | #92 | Exceptional $41,952 |
| Immigrants | Grenada | 99.0 /100 | #93 | Exceptional $41,932 |
Demographics Similar to Immigrants from Indonesia by Median Female Earnings
In terms of median female earnings, the demographic groups most similar to Immigrants from Indonesia are Immigrants from Serbia ($43,385, a difference of 0.060%), Bolivian ($43,445, a difference of 0.070%), Immigrants from Uzbekistan ($43,363, a difference of 0.11%), Immigrants from Bolivia ($43,467, a difference of 0.13%), and Maltese ($43,357, a difference of 0.13%).
| Demographics | Rating | Rank | Median Female Earnings |
| Bhutanese | 100.0 /100 | #41 | Exceptional $43,648 |
| Immigrants | Denmark | 100.0 /100 | #42 | Exceptional $43,646 |
| Bulgarians | 100.0 /100 | #43 | Exceptional $43,638 |
| Immigrants | Czechoslovakia | 100.0 /100 | #44 | Exceptional $43,571 |
| Immigrants | Europe | 100.0 /100 | #45 | Exceptional $43,523 |
| Immigrants | Bolivia | 100.0 /100 | #46 | Exceptional $43,467 |
| Bolivians | 100.0 /100 | #47 | Exceptional $43,445 |
| Immigrants | Indonesia | 100.0 /100 | #48 | Exceptional $43,412 |
| Immigrants | Serbia | 100.0 /100 | #49 | Exceptional $43,385 |
| Immigrants | Uzbekistan | 100.0 /100 | #50 | Exceptional $43,363 |
| Maltese | 100.0 /100 | #51 | Exceptional $43,357 |
| Immigrants | Lithuania | 99.9 /100 | #52 | Exceptional $43,317 |
| Immigrants | Eastern Europe | 99.9 /100 | #53 | Exceptional $43,309 |
| Australians | 99.9 /100 | #54 | Exceptional $43,308 |
| Egyptians | 99.9 /100 | #55 | Exceptional $43,305 |