Immigrants from Sri Lanka vs Filipino Median Family Income
COMPARE
Immigrants from Sri Lanka
Filipino
Median Family Income
Median Family Income Comparison
Immigrants from Sri Lanka
Filipinos
$120,263
MEDIAN FAMILY INCOME
100.0/ 100
METRIC RATING
30th/ 347
METRIC RANK
$138,397
MEDIAN FAMILY INCOME
100.0/ 100
METRIC RATING
1st/ 347
METRIC RANK
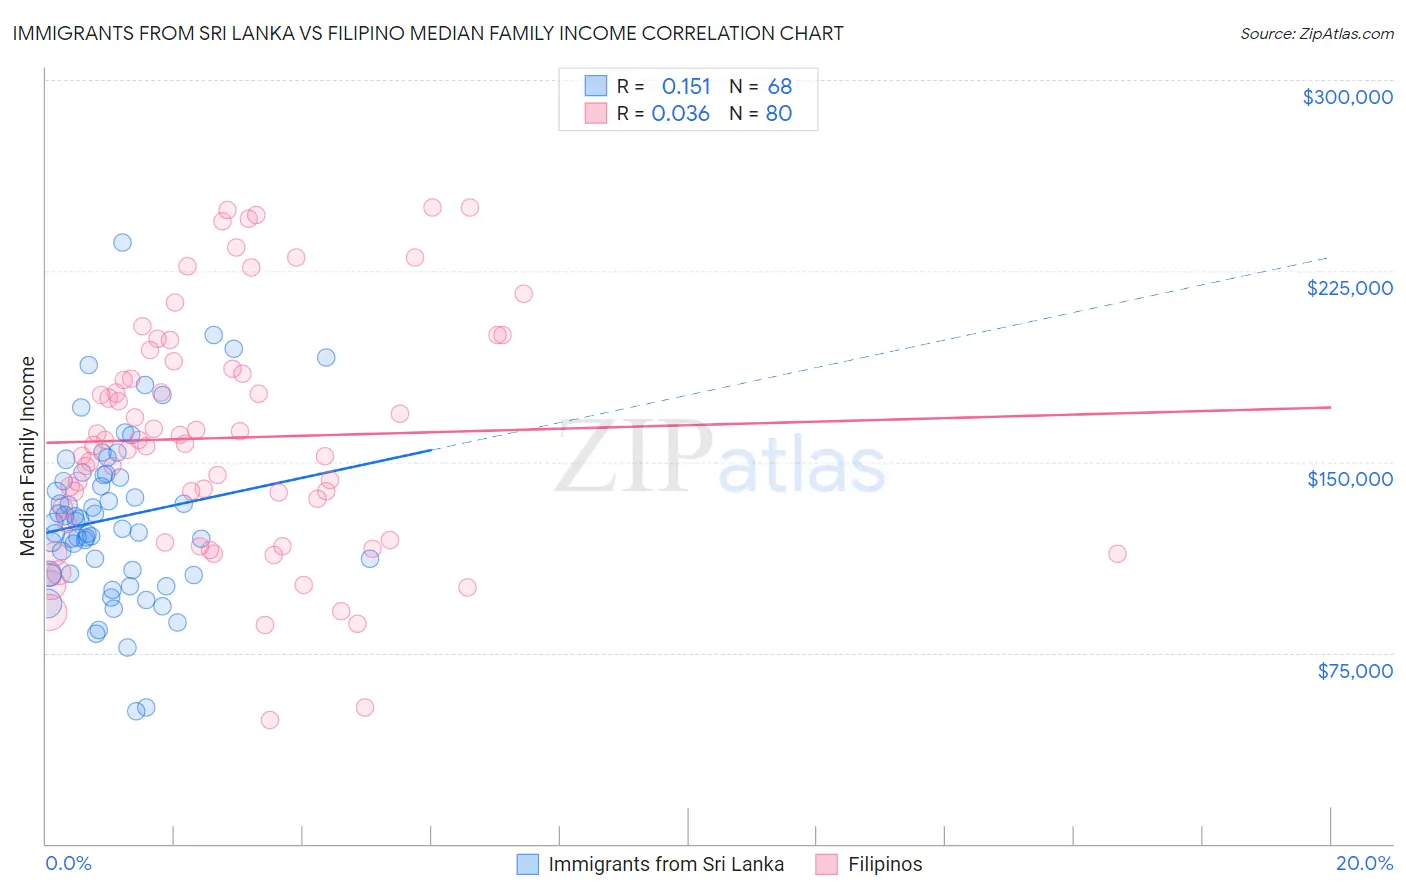
Immigrants from Sri Lanka vs Filipino Median Family Income Correlation Chart
The statistical analysis conducted on geographies consisting of 149,663,280 people shows a poor positive correlation between the proportion of Immigrants from Sri Lanka and median family income in the United States with a correlation coefficient (R) of 0.151 and weighted average of $120,263. Similarly, the statistical analysis conducted on geographies consisting of 254,105,404 people shows no correlation between the proportion of Filipinos and median family income in the United States with a correlation coefficient (R) of 0.036 and weighted average of $138,397, a difference of 15.1%.
Median Family Income Correlation Summary
| Measurement | Immigrants from Sri Lanka | Filipino |
| Minimum | $51,807 | $48,393 |
| Maximum | $236,102 | $250,001 |
| Range | $184,295 | $201,608 |
| Mean | $127,906 | $159,472 |
| Median | $125,011 | $156,854 |
| Interquartile 25% (IQ1) | $106,120 | $122,608 |
| Interquartile 75% (IQ3) | $144,308 | $188,025 |
| Interquartile Range (IQR) | $38,188 | $65,417 |
| Standard Deviation (Sample) | $33,114 | $46,927 |
| Standard Deviation (Population) | $32,870 | $46,633 |
Similar Demographics by Median Family Income
Demographics Similar to Immigrants from Sri Lanka by Median Family Income
In terms of median family income, the demographic groups most similar to Immigrants from Sri Lanka are Latvian ($120,301, a difference of 0.030%), Immigrants from Denmark ($120,445, a difference of 0.15%), Immigrants from France ($120,076, a difference of 0.16%), Russian ($120,487, a difference of 0.19%), and Asian ($119,955, a difference of 0.26%).
| Demographics | Rating | Rank | Median Family Income |
| Immigrants | Japan | 100.0 /100 | #23 | Exceptional $122,764 |
| Immigrants | Northern Europe | 100.0 /100 | #24 | Exceptional $121,840 |
| Turks | 100.0 /100 | #25 | Exceptional $121,202 |
| Immigrants | Switzerland | 100.0 /100 | #26 | Exceptional $120,726 |
| Russians | 100.0 /100 | #27 | Exceptional $120,487 |
| Immigrants | Denmark | 100.0 /100 | #28 | Exceptional $120,445 |
| Latvians | 100.0 /100 | #29 | Exceptional $120,301 |
| Immigrants | Sri Lanka | 100.0 /100 | #30 | Exceptional $120,263 |
| Immigrants | France | 100.0 /100 | #31 | Exceptional $120,076 |
| Asians | 100.0 /100 | #32 | Exceptional $119,955 |
| Bhutanese | 100.0 /100 | #33 | Exceptional $119,800 |
| Bolivians | 100.0 /100 | #34 | Exceptional $119,479 |
| Soviet Union | 100.0 /100 | #35 | Exceptional $119,262 |
| Israelis | 100.0 /100 | #36 | Exceptional $118,577 |
| Australians | 100.0 /100 | #37 | Exceptional $118,440 |
Demographics Similar to Filipinos by Median Family Income
In terms of median family income, the demographic groups most similar to Filipinos are Immigrants from Taiwan ($136,949, a difference of 1.1%), Immigrants from Singapore ($134,818, a difference of 2.6%), Immigrants from India ($134,028, a difference of 3.3%), Iranian ($133,839, a difference of 3.4%), and Thai ($131,281, a difference of 5.4%).
| Demographics | Rating | Rank | Median Family Income |
| Filipinos | 100.0 /100 | #1 | Exceptional $138,397 |
| Immigrants | Taiwan | 100.0 /100 | #2 | Exceptional $136,949 |
| Immigrants | Singapore | 100.0 /100 | #3 | Exceptional $134,818 |
| Immigrants | India | 100.0 /100 | #4 | Exceptional $134,028 |
| Iranians | 100.0 /100 | #5 | Exceptional $133,839 |
| Thais | 100.0 /100 | #6 | Exceptional $131,281 |
| Immigrants | Hong Kong | 100.0 /100 | #7 | Exceptional $131,067 |
| Immigrants | Iran | 100.0 /100 | #8 | Exceptional $130,894 |
| Okinawans | 100.0 /100 | #9 | Exceptional $129,979 |
| Immigrants | Ireland | 100.0 /100 | #10 | Exceptional $127,584 |
| Immigrants | Israel | 100.0 /100 | #11 | Exceptional $127,430 |
| Cypriots | 100.0 /100 | #12 | Exceptional $127,064 |
| Immigrants | Australia | 100.0 /100 | #13 | Exceptional $126,620 |
| Immigrants | South Central Asia | 100.0 /100 | #14 | Exceptional $125,956 |
| Eastern Europeans | 100.0 /100 | #15 | Exceptional $125,546 |