Immigrants from Sri Lanka vs Native/Alaskan 5th Grade
COMPARE
Immigrants from Sri Lanka
Native/Alaskan
5th Grade
5th Grade Comparison
Immigrants from Sri Lanka
Natives/Alaskans
97.3%
5TH GRADE
53.8/ 100
METRIC RATING
171st/ 347
METRIC RANK
97.2%
5TH GRADE
18.0/ 100
METRIC RATING
199th/ 347
METRIC RANK
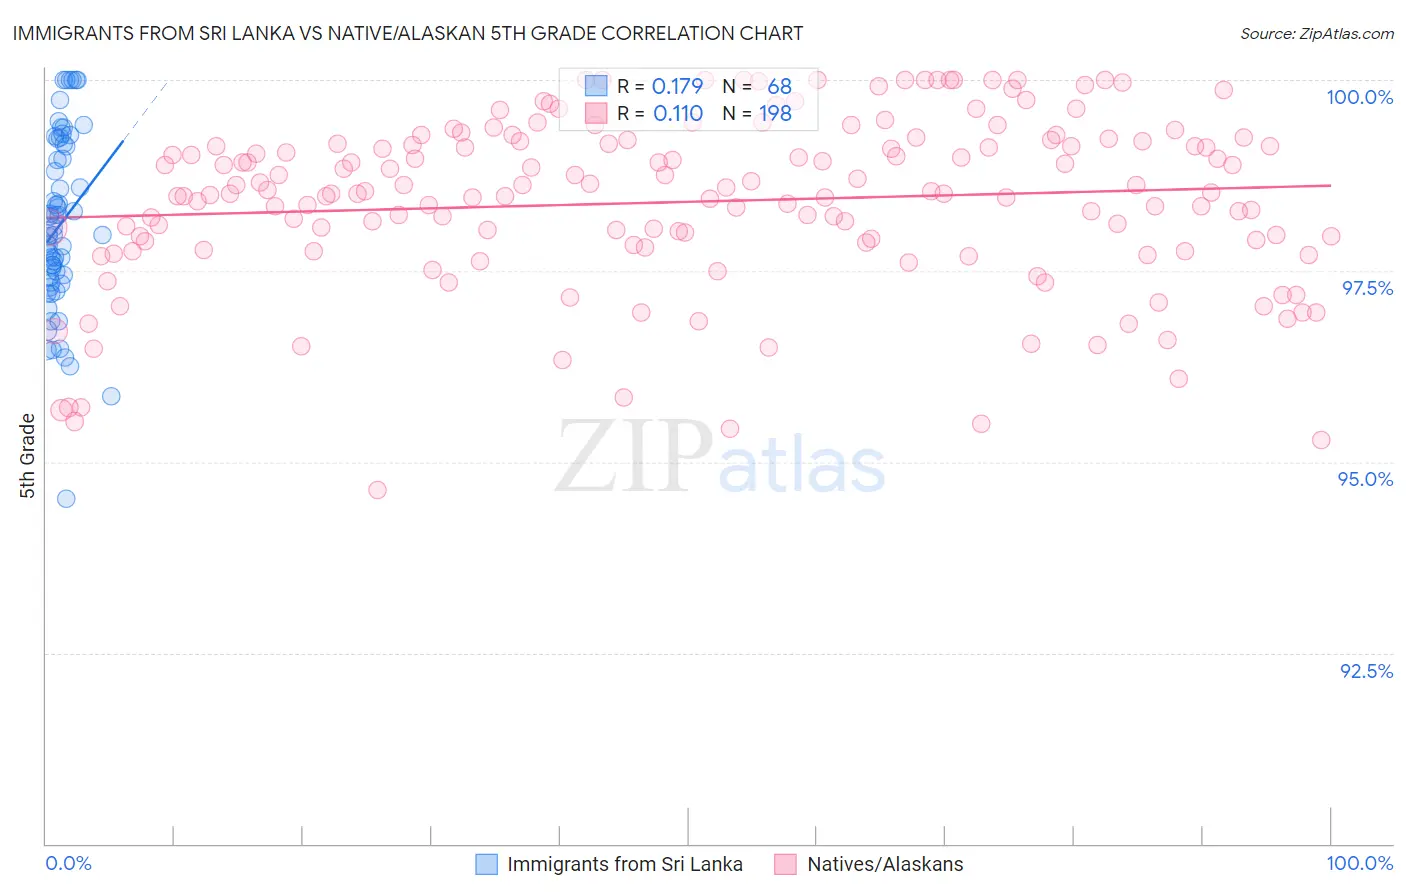
Immigrants from Sri Lanka vs Native/Alaskan 5th Grade Correlation Chart
The statistical analysis conducted on geographies consisting of 149,660,761 people shows a poor positive correlation between the proportion of Immigrants from Sri Lanka and percentage of population with at least 5th grade education in the United States with a correlation coefficient (R) of 0.179 and weighted average of 97.3%. Similarly, the statistical analysis conducted on geographies consisting of 513,072,444 people shows a poor positive correlation between the proportion of Natives/Alaskans and percentage of population with at least 5th grade education in the United States with a correlation coefficient (R) of 0.110 and weighted average of 97.2%, a difference of 0.17%.
5th Grade Correlation Summary
| Measurement | Immigrants from Sri Lanka | Native/Alaskan |
| Minimum | 94.5% | 94.6% |
| Maximum | 100.0% | 100.0% |
| Range | 5.5% | 5.4% |
| Mean | 98.1% | 98.4% |
| Median | 98.0% | 98.5% |
| Interquartile 25% (IQ1) | 97.4% | 97.8% |
| Interquartile 75% (IQ3) | 99.1% | 99.2% |
| Interquartile Range (IQR) | 1.8% | 1.3% |
| Standard Deviation (Sample) | 1.2% | 1.1% |
| Standard Deviation (Population) | 1.1% | 1.1% |
Similar Demographics by 5th Grade
Demographics Similar to Immigrants from Sri Lanka by 5th Grade
In terms of 5th grade, the demographic groups most similar to Immigrants from Sri Lanka are Immigrants from Belarus (97.3%, a difference of 0.0%), Chilean (97.3%, a difference of 0.0%), Immigrants from Korea (97.3%, a difference of 0.0%), Venezuelan (97.3%, a difference of 0.0%), and Arab (97.3%, a difference of 0.0%).
| Demographics | Rating | Rank | 5th Grade |
| Bermudans | 58.8 /100 | #164 | Average 97.4% |
| Immigrants | Poland | 57.9 /100 | #165 | Average 97.4% |
| Apache | 57.2 /100 | #166 | Average 97.4% |
| Immigrants | Belarus | 54.6 /100 | #167 | Average 97.3% |
| Chileans | 54.5 /100 | #168 | Average 97.3% |
| Immigrants | Korea | 54.1 /100 | #169 | Average 97.3% |
| Venezuelans | 54.0 /100 | #170 | Average 97.3% |
| Immigrants | Sri Lanka | 53.8 /100 | #171 | Average 97.3% |
| Arabs | 53.4 /100 | #172 | Average 97.3% |
| Egyptians | 52.4 /100 | #173 | Average 97.3% |
| Immigrants | Kazakhstan | 50.0 /100 | #174 | Average 97.3% |
| Immigrants | Micronesia | 48.8 /100 | #175 | Average 97.3% |
| Immigrants | Taiwan | 48.4 /100 | #176 | Average 97.3% |
| Immigrants | Spain | 47.0 /100 | #177 | Average 97.3% |
| Comanche | 42.1 /100 | #178 | Average 97.3% |
Demographics Similar to Natives/Alaskans by 5th Grade
In terms of 5th grade, the demographic groups most similar to Natives/Alaskans are Immigrants from Northern Africa (97.2%, a difference of 0.010%), Immigrants from Chile (97.2%, a difference of 0.010%), Immigrants from Uganda (97.2%, a difference of 0.020%), African (97.2%, a difference of 0.020%), and Immigrants from Bahamas (97.2%, a difference of 0.020%).
| Demographics | Rating | Rank | 5th Grade |
| Panamanians | 31.3 /100 | #192 | Fair 97.3% |
| Navajo | 29.0 /100 | #193 | Fair 97.2% |
| Immigrants | Albania | 28.5 /100 | #194 | Fair 97.2% |
| Guamanians/Chamorros | 26.8 /100 | #195 | Fair 97.2% |
| Hawaiians | 25.6 /100 | #196 | Fair 97.2% |
| Brazilians | 25.4 /100 | #197 | Fair 97.2% |
| Immigrants | Uganda | 21.1 /100 | #198 | Fair 97.2% |
| Natives/Alaskans | 18.0 /100 | #199 | Poor 97.2% |
| Immigrants | Northern Africa | 16.8 /100 | #200 | Poor 97.2% |
| Immigrants | Chile | 16.6 /100 | #201 | Poor 97.2% |
| Africans | 15.3 /100 | #202 | Poor 97.2% |
| Immigrants | Bahamas | 14.9 /100 | #203 | Poor 97.2% |
| Immigrants | Zaire | 13.7 /100 | #204 | Poor 97.1% |
| Moroccans | 12.0 /100 | #205 | Poor 97.1% |
| Paiute | 11.6 /100 | #206 | Poor 97.1% |