Northern European vs French Householder Income Ages 25 - 44 years
COMPARE
Northern European
French
Householder Income Ages 25 - 44 years
Householder Income Ages 25 - 44 years Comparison
Northern Europeans
French
$100,457
HOUSEHOLDER INCOME AGES 25 - 44 YEARS
96.3/ 100
METRIC RATING
107th/ 347
METRIC RANK
$93,665
HOUSEHOLDER INCOME AGES 25 - 44 YEARS
37.8/ 100
METRIC RATING
180th/ 347
METRIC RANK
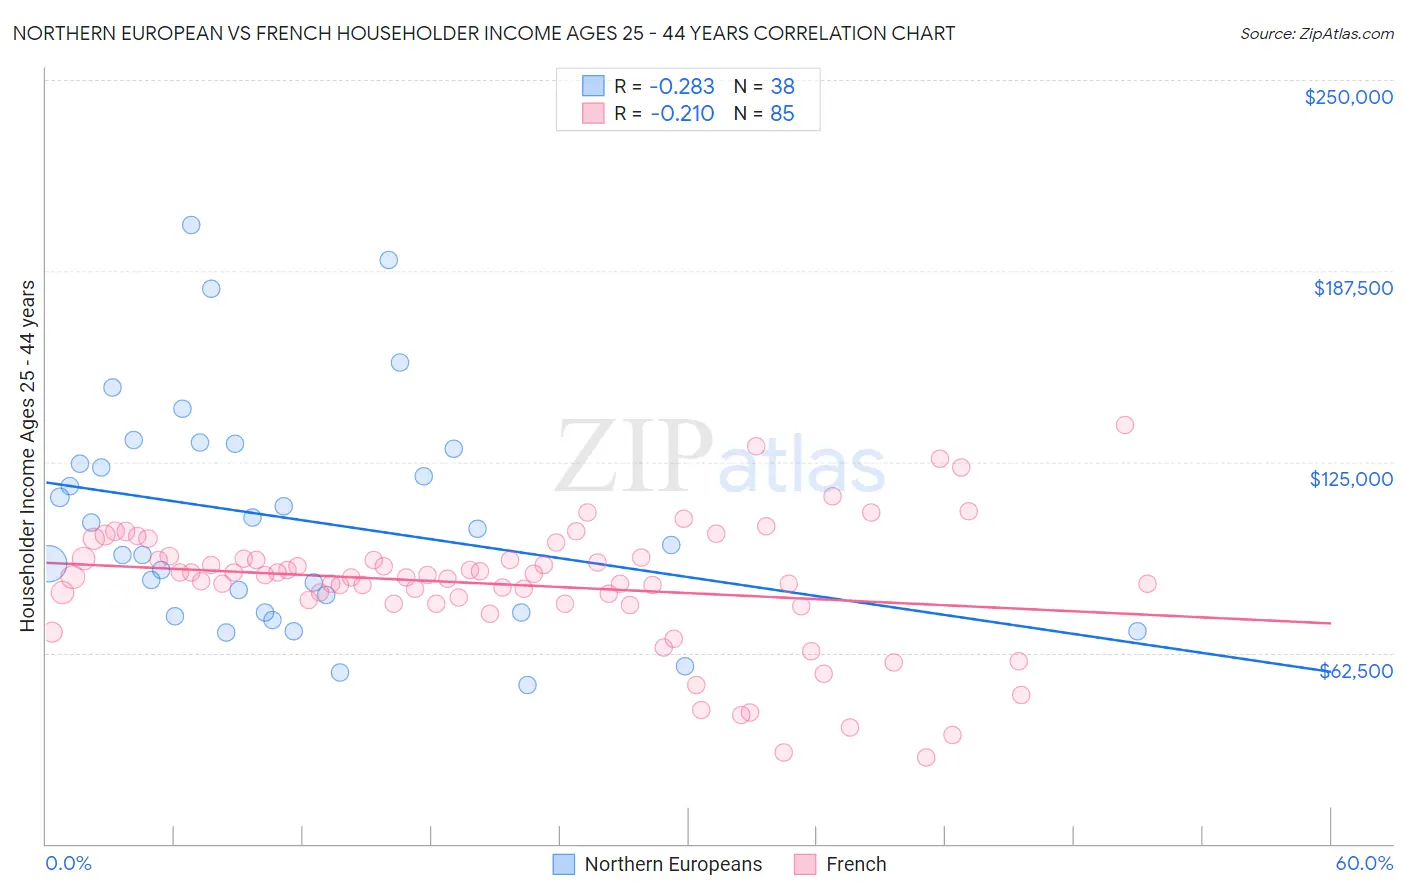
Northern European vs French Householder Income Ages 25 - 44 years Correlation Chart
The statistical analysis conducted on geographies consisting of 404,748,237 people shows a weak negative correlation between the proportion of Northern Europeans and household income with householder between the ages 25 and 44 in the United States with a correlation coefficient (R) of -0.283 and weighted average of $100,457. Similarly, the statistical analysis conducted on geographies consisting of 566,574,602 people shows a weak negative correlation between the proportion of French and household income with householder between the ages 25 and 44 in the United States with a correlation coefficient (R) of -0.210 and weighted average of $93,665, a difference of 7.2%.
Householder Income Ages 25 - 44 years Correlation Summary
| Measurement | Northern European | French |
| Minimum | $51,817 | $28,047 |
| Maximum | $202,571 | $137,237 |
| Range | $150,754 | $109,190 |
| Mean | $106,570 | $84,736 |
| Median | $100,458 | $87,325 |
| Interquartile 25% (IQ1) | $75,848 | $78,650 |
| Interquartile 75% (IQ3) | $129,485 | $93,493 |
| Interquartile Range (IQR) | $53,637 | $14,843 |
| Standard Deviation (Sample) | $36,774 | $21,004 |
| Standard Deviation (Population) | $36,287 | $20,880 |
Similar Demographics by Householder Income Ages 25 - 44 years
Demographics Similar to Northern Europeans by Householder Income Ages 25 - 44 years
In terms of householder income ages 25 - 44 years, the demographic groups most similar to Northern Europeans are Immigrants from Vietnam ($100,535, a difference of 0.080%), Immigrants from Brazil ($100,534, a difference of 0.080%), Immigrants from South Eastern Asia ($100,283, a difference of 0.17%), Immigrants from North Macedonia ($100,101, a difference of 0.36%), and Immigrants from Afghanistan ($99,977, a difference of 0.48%).
| Demographics | Rating | Rank | Householder Income Ages 25 - 44 years |
| Immigrants | Argentina | 97.8 /100 | #100 | Exceptional $101,415 |
| Albanians | 97.8 /100 | #101 | Exceptional $101,367 |
| Immigrants | Lebanon | 97.4 /100 | #102 | Exceptional $101,124 |
| Immigrants | Moldova | 97.4 /100 | #103 | Exceptional $101,091 |
| Immigrants | Poland | 97.4 /100 | #104 | Exceptional $101,065 |
| Immigrants | Vietnam | 96.5 /100 | #105 | Exceptional $100,535 |
| Immigrants | Brazil | 96.5 /100 | #106 | Exceptional $100,534 |
| Northern Europeans | 96.3 /100 | #107 | Exceptional $100,457 |
| Immigrants | South Eastern Asia | 96.0 /100 | #108 | Exceptional $100,283 |
| Immigrants | North Macedonia | 95.6 /100 | #109 | Exceptional $100,101 |
| Immigrants | Afghanistan | 95.3 /100 | #110 | Exceptional $99,977 |
| Chileans | 95.1 /100 | #111 | Exceptional $99,900 |
| Poles | 94.5 /100 | #112 | Exceptional $99,685 |
| Tongans | 94.2 /100 | #113 | Exceptional $99,604 |
| Immigrants | Western Asia | 94.0 /100 | #114 | Exceptional $99,516 |
Demographics Similar to French by Householder Income Ages 25 - 44 years
In terms of householder income ages 25 - 44 years, the demographic groups most similar to French are Puget Sound Salish ($93,661, a difference of 0.0%), French Canadian ($93,694, a difference of 0.030%), Uruguayan ($93,631, a difference of 0.040%), Guamanian/Chamorro ($93,569, a difference of 0.10%), and German ($93,531, a difference of 0.14%).
| Demographics | Rating | Rank | Householder Income Ages 25 - 44 years |
| Finns | 50.6 /100 | #173 | Average $94,610 |
| Colombians | 50.0 /100 | #174 | Average $94,565 |
| English | 48.1 /100 | #175 | Average $94,429 |
| Immigrants | Immigrants | 48.0 /100 | #176 | Average $94,423 |
| Belgians | 45.8 /100 | #177 | Average $94,262 |
| Immigrants | South America | 42.8 /100 | #178 | Average $94,042 |
| French Canadians | 38.2 /100 | #179 | Fair $93,694 |
| French | 37.8 /100 | #180 | Fair $93,665 |
| Puget Sound Salish | 37.7 /100 | #181 | Fair $93,661 |
| Uruguayans | 37.3 /100 | #182 | Fair $93,631 |
| Guamanians/Chamorros | 36.5 /100 | #183 | Fair $93,569 |
| Germans | 36.0 /100 | #184 | Fair $93,531 |
| Immigrants | Eritrea | 35.2 /100 | #185 | Fair $93,466 |
| Sierra Leoneans | 34.8 /100 | #186 | Fair $93,435 |
| Spaniards | 34.0 /100 | #187 | Fair $93,366 |