Immigrants from Southern Europe vs Immigrants from Iran Householder Income Ages 45 - 64 years
COMPARE
Immigrants from Southern Europe
Immigrants from Iran
Householder Income Ages 45 - 64 years
Householder Income Ages 45 - 64 years Comparison
Immigrants from Southern Europe
Immigrants from Iran
$107,775
HOUSEHOLDER INCOME AGES 45 - 64 YEARS
97.7/ 100
METRIC RATING
98th/ 347
METRIC RANK
$126,940
HOUSEHOLDER INCOME AGES 45 - 64 YEARS
100.0/ 100
METRIC RATING
8th/ 347
METRIC RANK
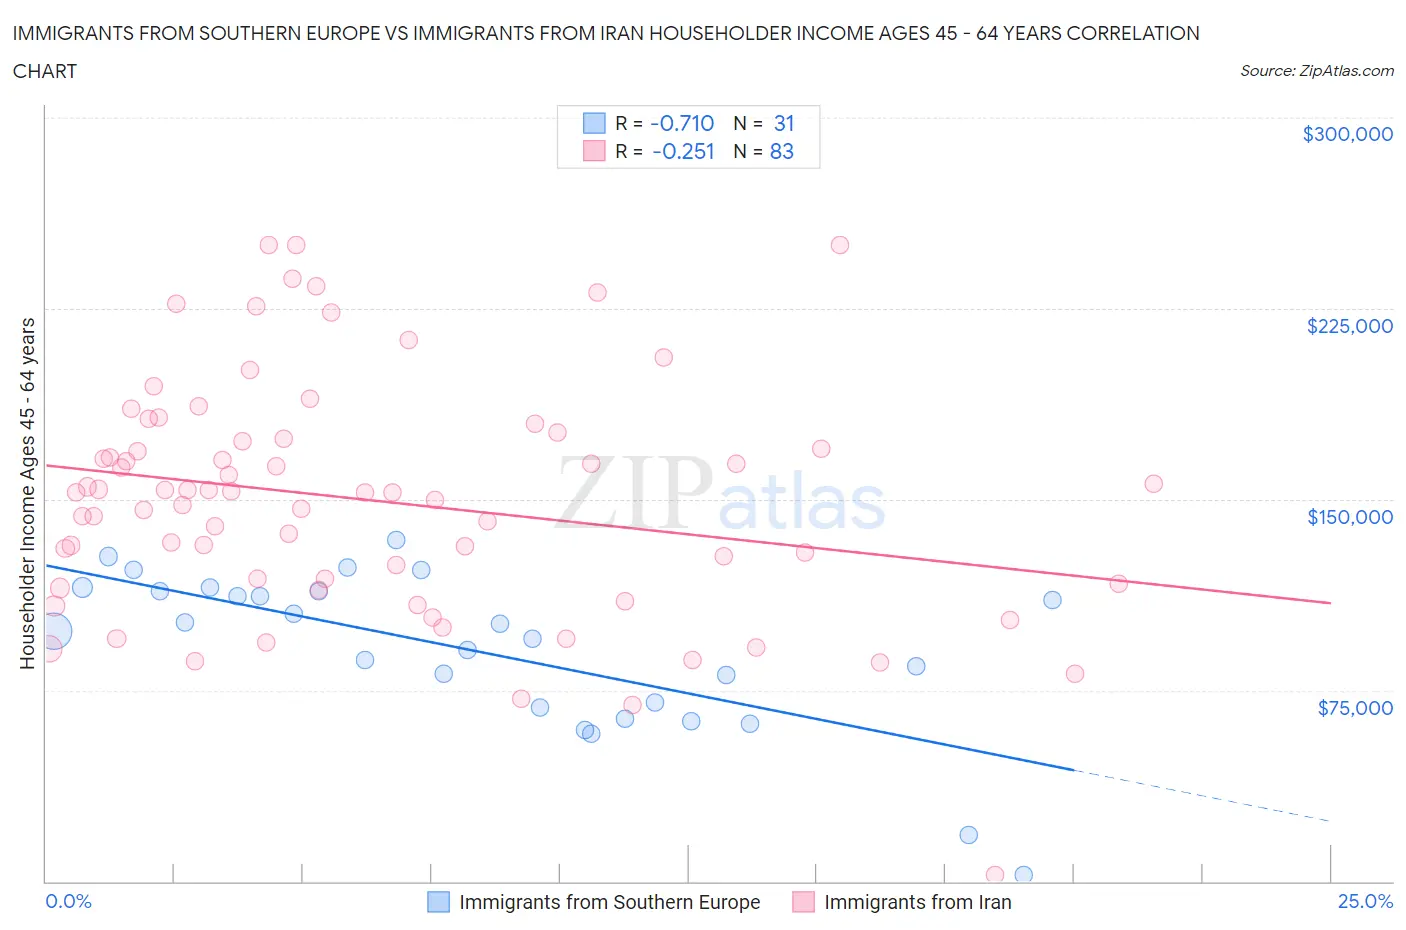
Immigrants from Southern Europe vs Immigrants from Iran Householder Income Ages 45 - 64 years Correlation Chart
The statistical analysis conducted on geographies consisting of 402,204,768 people shows a strong negative correlation between the proportion of Immigrants from Southern Europe and household income with householder between the ages 45 and 64 in the United States with a correlation coefficient (R) of -0.710 and weighted average of $107,775. Similarly, the statistical analysis conducted on geographies consisting of 279,706,842 people shows a weak negative correlation between the proportion of Immigrants from Iran and household income with householder between the ages 45 and 64 in the United States with a correlation coefficient (R) of -0.251 and weighted average of $126,940, a difference of 17.8%.
Householder Income Ages 45 - 64 years Correlation Summary
| Measurement | Immigrants from Southern Europe | Immigrants from Iran |
| Minimum | $2,499 | $2,499 |
| Maximum | $134,237 | $250,001 |
| Range | $131,738 | $247,502 |
| Mean | $90,713 | $149,657 |
| Median | $98,268 | $152,624 |
| Interquartile 25% (IQ1) | $68,345 | $116,625 |
| Interquartile 75% (IQ3) | $113,880 | $173,869 |
| Interquartile Range (IQR) | $45,535 | $57,244 |
| Standard Deviation (Sample) | $31,080 | $46,822 |
| Standard Deviation (Population) | $30,575 | $46,539 |
Similar Demographics by Householder Income Ages 45 - 64 years
Demographics Similar to Immigrants from Southern Europe by Householder Income Ages 45 - 64 years
In terms of householder income ages 45 - 64 years, the demographic groups most similar to Immigrants from Southern Europe are Palestinian ($107,721, a difference of 0.050%), Northern European ($107,870, a difference of 0.090%), Immigrants from Serbia ($107,569, a difference of 0.19%), Immigrants from Kazakhstan ($107,378, a difference of 0.37%), and Immigrants from Moldova ($107,357, a difference of 0.39%).
| Demographics | Rating | Rank | Householder Income Ages 45 - 64 years |
| Immigrants | Lebanon | 98.3 /100 | #91 | Exceptional $108,471 |
| Croatians | 98.3 /100 | #92 | Exceptional $108,383 |
| Immigrants | Croatia | 98.2 /100 | #93 | Exceptional $108,304 |
| Sri Lankans | 98.2 /100 | #94 | Exceptional $108,270 |
| Immigrants | Hungary | 98.2 /100 | #95 | Exceptional $108,267 |
| Immigrants | Argentina | 98.2 /100 | #96 | Exceptional $108,264 |
| Northern Europeans | 97.8 /100 | #97 | Exceptional $107,870 |
| Immigrants | Southern Europe | 97.7 /100 | #98 | Exceptional $107,775 |
| Palestinians | 97.6 /100 | #99 | Exceptional $107,721 |
| Immigrants | Serbia | 97.4 /100 | #100 | Exceptional $107,569 |
| Immigrants | Kazakhstan | 97.2 /100 | #101 | Exceptional $107,378 |
| Immigrants | Moldova | 97.1 /100 | #102 | Exceptional $107,357 |
| Syrians | 96.9 /100 | #103 | Exceptional $107,207 |
| Immigrants | Ukraine | 96.7 /100 | #104 | Exceptional $107,079 |
| Macedonians | 96.7 /100 | #105 | Exceptional $107,074 |
Demographics Similar to Immigrants from Iran by Householder Income Ages 45 - 64 years
In terms of householder income ages 45 - 64 years, the demographic groups most similar to Immigrants from Iran are Immigrants from Hong Kong ($127,500, a difference of 0.44%), Okinawan ($124,796, a difference of 1.7%), Iranian ($129,350, a difference of 1.9%), Immigrants from Singapore ($129,514, a difference of 2.0%), and Thai ($129,560, a difference of 2.1%).
| Demographics | Rating | Rank | Householder Income Ages 45 - 64 years |
| Immigrants | Taiwan | 100.0 /100 | #1 | Exceptional $135,508 |
| Filipinos | 100.0 /100 | #2 | Exceptional $134,910 |
| Immigrants | India | 100.0 /100 | #3 | Exceptional $132,488 |
| Thais | 100.0 /100 | #4 | Exceptional $129,560 |
| Immigrants | Singapore | 100.0 /100 | #5 | Exceptional $129,514 |
| Iranians | 100.0 /100 | #6 | Exceptional $129,350 |
| Immigrants | Hong Kong | 100.0 /100 | #7 | Exceptional $127,500 |
| Immigrants | Iran | 100.0 /100 | #8 | Exceptional $126,940 |
| Okinawans | 100.0 /100 | #9 | Exceptional $124,796 |
| Immigrants | South Central Asia | 100.0 /100 | #10 | Exceptional $124,188 |
| Cypriots | 100.0 /100 | #11 | Exceptional $123,396 |
| Immigrants | Israel | 100.0 /100 | #12 | Exceptional $122,893 |
| Immigrants | Ireland | 100.0 /100 | #13 | Exceptional $122,757 |
| Indians (Asian) | 100.0 /100 | #14 | Exceptional $122,343 |
| Immigrants | Eastern Asia | 100.0 /100 | #15 | Exceptional $122,222 |