Immigrants from Southern Europe vs Croatian Unemployment Among Women with Children Ages 6 to 17 years
COMPARE
Immigrants from Southern Europe
Croatian
Unemployment Among Women with Children Ages 6 to 17 years
Unemployment Among Women with Children Ages 6 to 17 years Comparison
Immigrants from Southern Europe
Croatians
9.2%
UNEMPLOYMENT AMONG WOMEN WITH CHILDREN AGES 6 TO 17 YEARS
5.8/ 100
METRIC RATING
222nd/ 347
METRIC RANK
8.8%
UNEMPLOYMENT AMONG WOMEN WITH CHILDREN AGES 6 TO 17 YEARS
76.0/ 100
METRIC RATING
149th/ 347
METRIC RANK
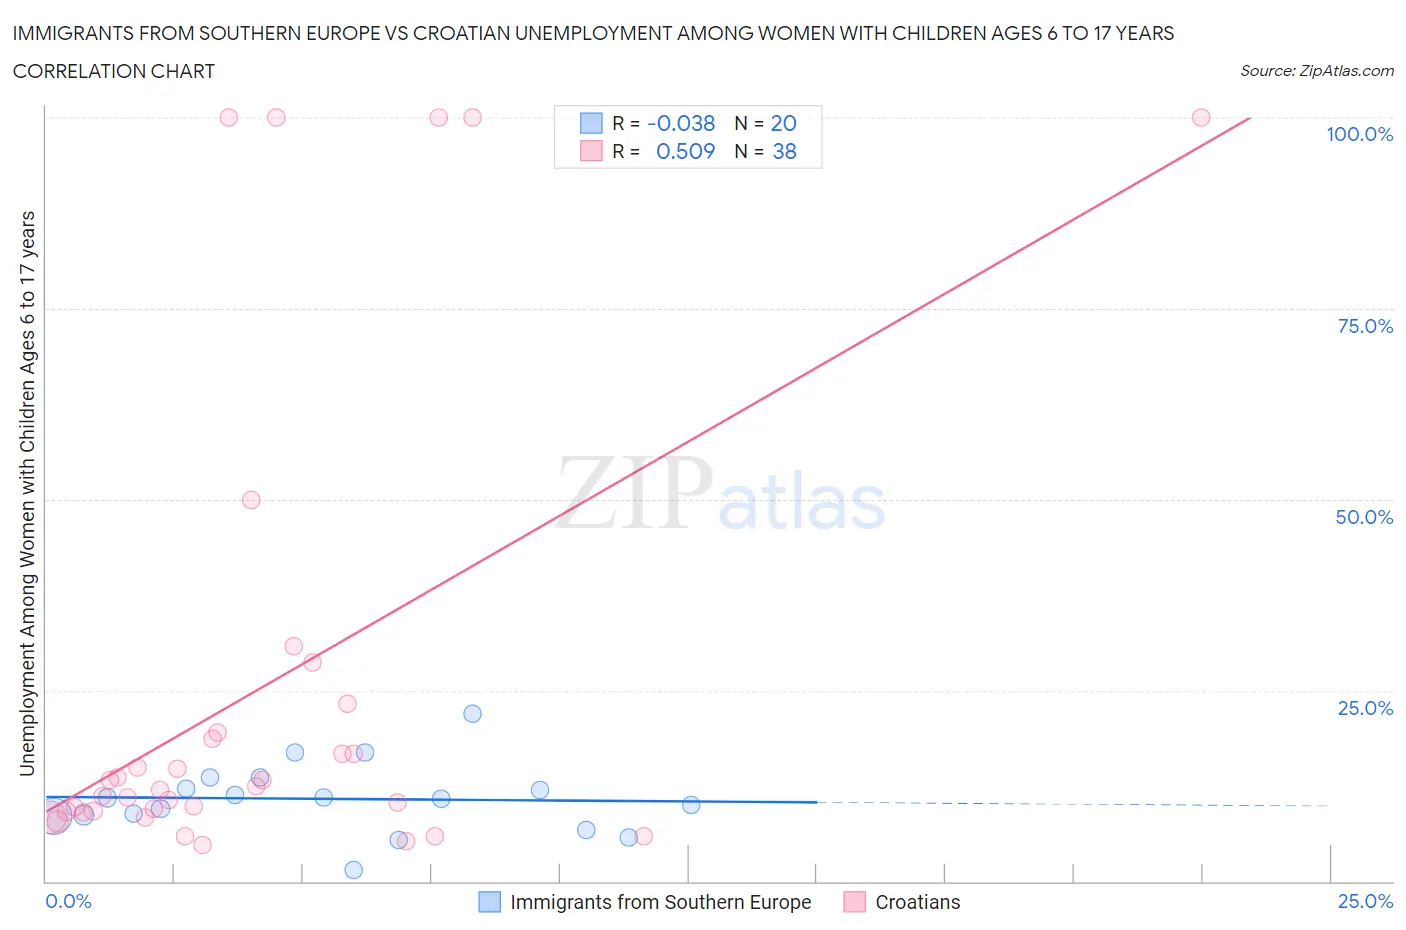
Immigrants from Southern Europe vs Croatian Unemployment Among Women with Children Ages 6 to 17 years Correlation Chart
The statistical analysis conducted on geographies consisting of 285,916,862 people shows no correlation between the proportion of Immigrants from Southern Europe and unemployment rate among women with children between the ages 6 and 17 in the United States with a correlation coefficient (R) of -0.038 and weighted average of 9.2%. Similarly, the statistical analysis conducted on geographies consisting of 264,265,692 people shows a substantial positive correlation between the proportion of Croatians and unemployment rate among women with children between the ages 6 and 17 in the United States with a correlation coefficient (R) of 0.509 and weighted average of 8.8%, a difference of 4.4%.
Unemployment Among Women with Children Ages 6 to 17 years Correlation Summary
| Measurement | Immigrants from Southern Europe | Croatian |
| Minimum | 1.4% | 4.8% |
| Maximum | 22.0% | 100.0% |
| Range | 20.6% | 95.2% |
| Mean | 10.8% | 25.0% |
| Median | 10.9% | 12.2% |
| Interquartile 25% (IQ1) | 8.6% | 9.1% |
| Interquartile 75% (IQ3) | 12.8% | 19.5% |
| Interquartile Range (IQR) | 4.2% | 10.3% |
| Standard Deviation (Sample) | 4.6% | 30.7% |
| Standard Deviation (Population) | 4.4% | 30.3% |
Similar Demographics by Unemployment Among Women with Children Ages 6 to 17 years
Demographics Similar to Immigrants from Southern Europe by Unemployment Among Women with Children Ages 6 to 17 years
In terms of unemployment among women with children ages 6 to 17 years, the demographic groups most similar to Immigrants from Southern Europe are Crow (9.2%, a difference of 0.010%), Immigrants from Eritrea (9.2%, a difference of 0.010%), Immigrants from El Salvador (9.3%, a difference of 0.11%), Belgian (9.2%, a difference of 0.12%), and Chinese (9.3%, a difference of 0.12%).
| Demographics | Rating | Rank | Unemployment Among Women with Children Ages 6 to 17 years |
| Immigrants | Germany | 7.2 /100 | #215 | Tragic 9.2% |
| Immigrants | Uruguay | 7.2 /100 | #216 | Tragic 9.2% |
| Germans | 7.2 /100 | #217 | Tragic 9.2% |
| Syrians | 6.9 /100 | #218 | Tragic 9.2% |
| Immigrants | Scotland | 6.6 /100 | #219 | Tragic 9.2% |
| Belgians | 6.4 /100 | #220 | Tragic 9.2% |
| Crow | 5.8 /100 | #221 | Tragic 9.2% |
| Immigrants | Southern Europe | 5.8 /100 | #222 | Tragic 9.2% |
| Immigrants | Eritrea | 5.8 /100 | #223 | Tragic 9.2% |
| Immigrants | El Salvador | 5.3 /100 | #224 | Tragic 9.3% |
| Chinese | 5.2 /100 | #225 | Tragic 9.3% |
| Immigrants | Azores | 4.6 /100 | #226 | Tragic 9.3% |
| Panamanians | 4.5 /100 | #227 | Tragic 9.3% |
| Estonians | 4.4 /100 | #228 | Tragic 9.3% |
| Lumbee | 4.3 /100 | #229 | Tragic 9.3% |
Demographics Similar to Croatians by Unemployment Among Women with Children Ages 6 to 17 years
In terms of unemployment among women with children ages 6 to 17 years, the demographic groups most similar to Croatians are Greek (8.9%, a difference of 0.050%), Costa Rican (8.8%, a difference of 0.060%), Immigrants from Eastern Africa (8.9%, a difference of 0.090%), Immigrants from Northern Europe (8.9%, a difference of 0.090%), and Immigrants from Europe (8.9%, a difference of 0.16%).
| Demographics | Rating | Rank | Unemployment Among Women with Children Ages 6 to 17 years |
| Immigrants | Austria | 87.5 /100 | #142 | Excellent 8.8% |
| Immigrants | Kenya | 86.1 /100 | #143 | Excellent 8.8% |
| Russians | 85.8 /100 | #144 | Excellent 8.8% |
| Kenyans | 85.6 /100 | #145 | Excellent 8.8% |
| Chileans | 80.8 /100 | #146 | Excellent 8.8% |
| Immigrants | Bangladesh | 79.4 /100 | #147 | Good 8.8% |
| Costa Ricans | 77.0 /100 | #148 | Good 8.8% |
| Croatians | 76.0 /100 | #149 | Good 8.8% |
| Greeks | 75.2 /100 | #150 | Good 8.9% |
| Immigrants | Eastern Africa | 74.6 /100 | #151 | Good 8.9% |
| Immigrants | Northern Europe | 74.6 /100 | #152 | Good 8.9% |
| Immigrants | Europe | 73.4 /100 | #153 | Good 8.9% |
| Vietnamese | 72.1 /100 | #154 | Good 8.9% |
| Immigrants | Greece | 71.8 /100 | #155 | Good 8.9% |
| Osage | 65.9 /100 | #156 | Good 8.9% |