Immigrants from Spain vs Immigrants from Guyana Householder Income Ages 45 - 64 years

COMPARE

Immigrants from Spain
Race
Ancestry
AfghanAfricanAlaska NativeAlaskan AthabascanAlbanianAleutAlsatianAmericanApacheArabArapahoArgentineanArmenianAssyrian/Chaldean/SyriacAustralianAustrianBahamianBangladeshiBarbadianBasqueBelgianBelizeanBermudanBhutaneseBlackfeetBolivianBrazilianBritishBritish West IndianBulgarianBurmeseCajunCambodianCanadianCape VerdeanCarpatho RusynCelticCentral AmericanCentral American IndianCherokeeCheyenneChickasawChileanChineseChippewaChoctawColombianColvilleComancheCosta RicanCreeCreekCroatianCrowCubanCypriotCzechCzechoslovakianDanishDelawareDominicanDutchDutch West IndianEastern EuropeanEcuadorianEgyptianEnglishEstonianEthiopianEuropeanFijianFilipinoFinnishFrenchFrench American IndianFrench CanadianGermanGerman RussianGhanaianGreekGuamanian/ChamorroGuatemalanGuyaneseHaitianHmongHonduranHopiHoumaHungarianIcelanderIndian (Asian)IndonesianInupiatIranianIraqiIrishIroquoisIsraeliItalianJamaicanJapaneseJordanianKenyanKiowaKoreanLaotianLatvianLebaneseLiberianLithuanianLumbeeLuxembourgerMacedonianMalaysianMalteseMarshalleseMenomineeMexicanMexican American IndianMongolianMoroccanNative HawaiianNavajoNepaleseNew ZealanderNicaraguanNigerianNorthern EuropeanNorwegianOkinawanOsageOttawaPaiutePakistaniPalestinianPanamanianParaguayanPennsylvania GermanPeruvianPimaPolishPortuguesePotawatomiPuebloPuerto RicanPuget Sound SalishRomanianRussianSalvadoranSamoanScandinavianScotch-IrishScottishSeminoleSenegaleseSerbianShoshoneSierra LeoneanSiouxSlavicSlovakSloveneSomaliSouth AfricanSouth AmericanSouth American IndianSoviet UnionSpaniardSpanishSpanish AmericanSpanish American IndianSri LankanSubsaharan AfricanSudaneseSwedishSwissSyrianTaiwaneseThaiTlingit-HaidaTohono O'OdhamTonganTrinidadian and TobagonianTsimshianTurkishU.S. Virgin IslanderUgandanUkrainianUruguayanUteVenezuelanVietnameseWelshWest IndianYakamaYaquiYugoslavianYumanYup'ikZimbabwean
Immigration
NonimmigrantsImmigrantsAfghanistanAfricaAlbaniaArgentinaArmeniaAsiaAustraliaAustriaBahamasBangladeshBarbadosBelarusBelgiumBelizeBoliviaBosnia and HerzegovinaBrazilBulgariaBurma/MyanmarCabo VerdeCambodiaCameroonCanadaCaribbeanCentral AmericaChileChinaColombiaCongoCosta RicaCroatiaCubaCzechoslovakiaDenmarkDominicaDominican RepublicEastern AfricaEastern AsiaEastern EuropeEcuadorEgyptEl SalvadorEnglandEritreaEthiopiaEuropeFijiFranceGermanyGhanaGreeceGrenadaGuatemalaHaitiHondurasHong KongHungaryIndiaIndonesiaIranIraqIrelandIsraelItalyJamaicaJapanJordanKazakhstanKenyaKoreaKuwaitLaosLatin AmericaLatviaLebanonLiberiaLithuaniaMalaysiaMexicoMicronesiaMiddle AfricaMoldovaMoroccoNepalNetherlandsNicaraguaNigeriaNorth AmericaNorth MacedoniaNorthern AfricaNorthern EuropeNorwayOceaniaPakistanPanamaPeruPhilippinesPolandPortugalRomaniaRussiaSaudi ArabiaScotlandSenegalSerbiaSierra LeoneSingaporeSomaliaSouth AfricaSouth AmericaSouth Central AsiaSouth Eastern AsiaSouthern EuropeSpainSri LankaSt. Vincent and the GrenadinesSudanSwedenSwitzerlandSyriaTaiwanThailandTrinidad and TobagoTurkeyUgandaUkraineUruguayUzbekistanVenezuelaVietnamWest IndiesWestern AfricaWestern AsiaWestern EuropeYemenZaireZimbabweAzores
Immigrants from Guyana
Race
Ancestry
AfghanAfricanAlaska NativeAlaskan AthabascanAlbanianAleutAlsatianAmericanApacheArabArapahoArgentineanArmenianAssyrian/Chaldean/SyriacAustralianAustrianBahamianBangladeshiBarbadianBasqueBelgianBelizeanBermudanBhutaneseBlackfeetBolivianBrazilianBritishBritish West IndianBulgarianBurmeseCajunCambodianCanadianCape VerdeanCarpatho RusynCelticCentral AmericanCentral American IndianCherokeeCheyenneChickasawChileanChineseChippewaChoctawColombianColvilleComancheCosta RicanCreeCreekCroatianCrowCubanCypriotCzechCzechoslovakianDanishDelawareDominicanDutchDutch West IndianEastern EuropeanEcuadorianEgyptianEnglishEstonianEthiopianEuropeanFijianFilipinoFinnishFrenchFrench American IndianFrench CanadianGermanGerman RussianGhanaianGreekGuamanian/ChamorroGuatemalanGuyaneseHaitianHmongHonduranHopiHoumaHungarianIcelanderIndian (Asian)IndonesianInupiatIranianIraqiIrishIroquoisIsraeliItalianJamaicanJapaneseJordanianKenyanKiowaKoreanLaotianLatvianLebaneseLiberianLithuanianLumbeeLuxembourgerMacedonianMalaysianMalteseMarshalleseMenomineeMexicanMexican American IndianMongolianMoroccanNative HawaiianNavajoNepaleseNew ZealanderNicaraguanNigerianNorthern EuropeanNorwegianOkinawanOsageOttawaPaiutePakistaniPalestinianPanamanianParaguayanPennsylvania GermanPeruvianPimaPolishPortuguesePotawatomiPuebloPuerto RicanPuget Sound SalishRomanianRussianSalvadoranSamoanScandinavianScotch-IrishScottishSeminoleSenegaleseSerbianShoshoneSierra LeoneanSiouxSlavicSlovakSloveneSomaliSouth AfricanSouth AmericanSouth American IndianSoviet UnionSpaniardSpanishSpanish AmericanSpanish American IndianSri LankanSubsaharan AfricanSudaneseSwedishSwissSyrianTaiwaneseThaiTlingit-HaidaTohono O'OdhamTonganTrinidadian and TobagonianTsimshianTurkishU.S. Virgin IslanderUgandanUkrainianUruguayanUteVenezuelanVietnameseWelshWest IndianYakamaYaquiYugoslavianYumanYup'ikZimbabwean
Immigration
NonimmigrantsImmigrantsAfghanistanAfricaAlbaniaArgentinaArmeniaAsiaAustraliaAustriaBahamasBangladeshBarbadosBelarusBelgiumBelizeBoliviaBosnia and HerzegovinaBrazilBulgariaBurma/MyanmarCabo VerdeCambodiaCameroonCanadaCaribbeanCentral AmericaChileChinaColombiaCongoCosta RicaCroatiaCubaCzechoslovakiaDenmarkDominicaDominican RepublicEastern AfricaEastern AsiaEastern EuropeEcuadorEgyptEl SalvadorEnglandEritreaEthiopiaEuropeFijiFranceGermanyGhanaGreeceGrenadaGuatemalaGuyanaHaitiHondurasHong KongHungaryIndiaIndonesiaIranIraqIrelandIsraelItalyJamaicaJapanJordanKazakhstanKenyaKoreaKuwaitLaosLatin AmericaLatviaLebanonLiberiaLithuaniaMalaysiaMexicoMicronesiaMiddle AfricaMoldovaMoroccoNepalNetherlandsNicaraguaNigeriaNorth AmericaNorth MacedoniaNorthern AfricaNorthern EuropeNorwayOceaniaPakistanPanamaPeruPhilippinesPolandPortugalRomaniaRussiaSaudi ArabiaScotlandSenegalSerbiaSierra LeoneSingaporeSomaliaSouth AfricaSouth AmericaSouth Central AsiaSouth Eastern AsiaSouthern EuropeSri LankaSt. Vincent and the GrenadinesSudanSwedenSwitzerlandSyriaTaiwanThailandTrinidad and TobagoTurkeyUgandaUkraineUruguayUzbekistanVenezuelaVietnamWest IndiesWestern AfricaWestern AsiaWestern EuropeYemenZaireZimbabweAzores
Householder Income Ages 45 - 64 years
Income
Poverty
Unemployment
Labor Participation
Family Structure
Vehicle Availability
Education Level
Disability

Householder Income Ages 45 - 64 years Comparison

Immigrants from Spain

Immigrants from Guyana

Exceptional
Tragic
$109,051
HOUSEHOLDER INCOME AGES 45 - 64 YEARS
98.8/ 100
METRIC RATING
83rd/ 347
METRIC RANK
$90,186
HOUSEHOLDER INCOME AGES 45 - 64 YEARS
0.6/ 100
METRIC RATING
254th/ 347
METRIC RANK

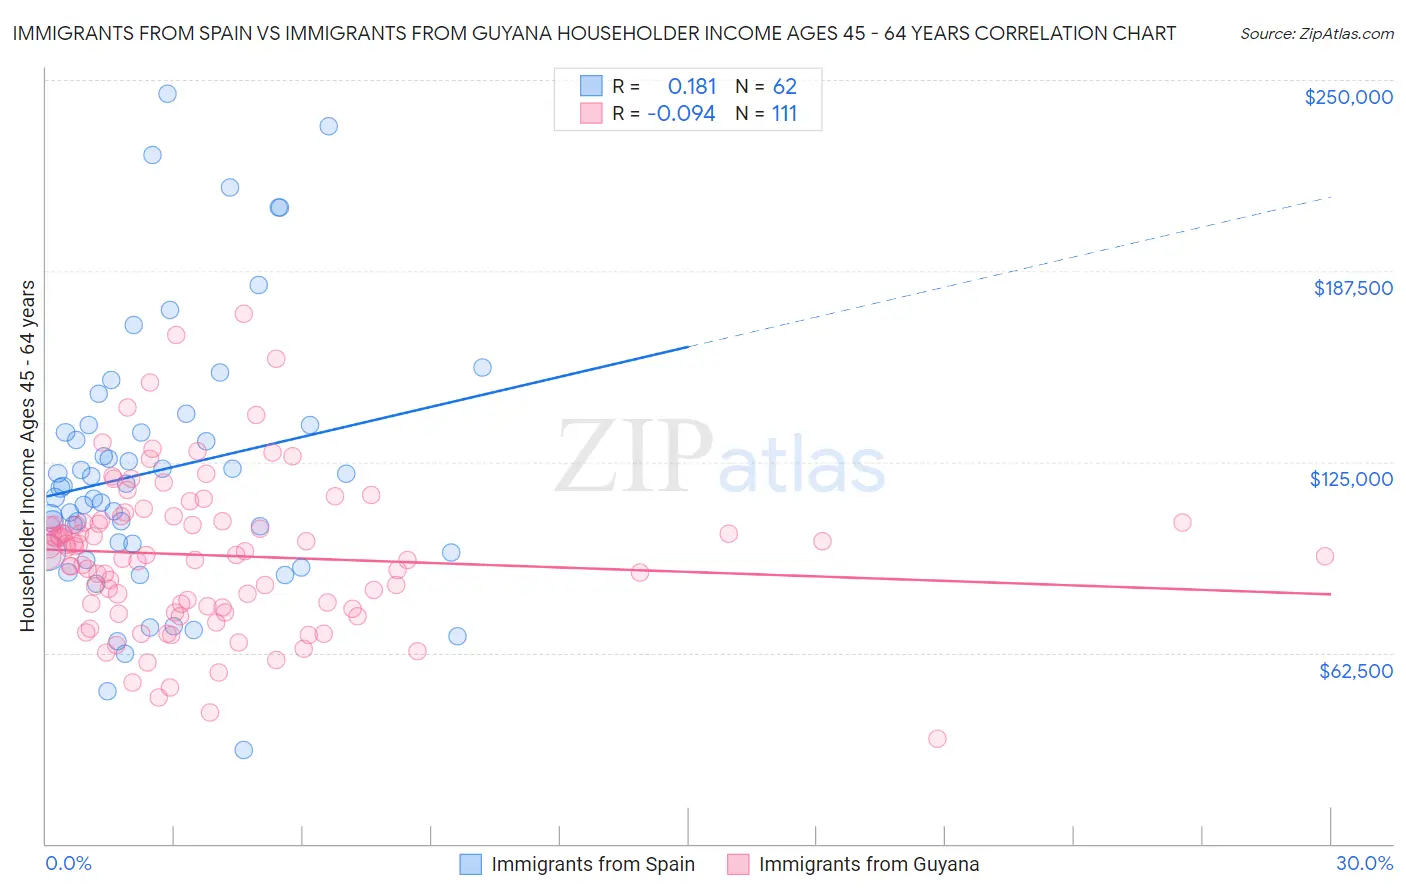
Immigrants from Spain vs Immigrants from Guyana Householder Income Ages 45 - 64 years Correlation Chart

The statistical analysis conducted on geographies consisting of 239,440,989 people shows a poor positive correlation between the proportion of Immigrants from Spain and household income with householder between the ages 45 and 64 in the United States with a correlation coefficient (R) of 0.181 and weighted average of $109,051. Similarly, the statistical analysis conducted on geographies consisting of 183,608,154 people shows a slight negative correlation between the proportion of Immigrants from Guyana and household income with householder between the ages 45 and 64 in the United States with a correlation coefficient (R) of -0.094 and weighted average of $90,186, a difference of 20.9%.
Immigrants from Spain vs Immigrants from Guyana Householder Income Ages 45 - 64 years

Householder Income Ages 45 - 64 years Correlation Summary

MeasurementImmigrants from SpainImmigrants from Guyana
Minimum$30,870$34,531
Maximum$245,443$173,438
Range$214,573$138,907
Mean$122,412$94,395
Median$116,851$94,422
Interquartile 25% (IQ1)$95,313$77,393
Interquartile 75% (IQ3)$137,063$105,417
Interquartile Range (IQR)$41,750$28,024
Standard Deviation (Sample)$44,097$24,856
Standard Deviation (Population)$43,740$24,743

Similar Demographics by Householder Income Ages 45 - 64 years

Demographics Similar to Immigrants from Spain by Householder Income Ages 45 - 64 years

In terms of householder income ages 45 - 64 years, the demographic groups most similar to Immigrants from Spain are Immigrants from North America ($109,198, a difference of 0.14%), Immigrants from Western Europe ($108,824, a difference of 0.21%), Immigrants from Afghanistan ($108,785, a difference of 0.24%), Immigrants from Eastern Europe ($109,335, a difference of 0.26%), and Immigrants from Bulgaria ($109,379, a difference of 0.30%).
DemographicsRating | RankHouseholder Income Ages 45 - 64 years
Paraguayans
99.0
/100
|
#76
Exceptional
$109,447
Immigrants | England
99.0
/100
|
#77
Exceptional
$109,446
Immigrants | Canada
99.0
/100
|
#78
Exceptional
$109,402
Immigrants | Bulgaria
98.9
/100
|
#79
Exceptional
$109,379
Jordanians
98.9
/100
|
#80
Exceptional
$109,376
Immigrants | Eastern Europe
98.9
/100
|
#81
Exceptional
$109,335
Immigrants | North America
98.8
/100
|
#82
Exceptional
$109,198
Immigrants | Spain
98.8
/100
|
#83
Exceptional
$109,051
Immigrants | Western Europe
98.6
/100
|
#84
Exceptional
$108,824
Immigrants | Afghanistan
98.6
/100
|
#85
Exceptional
$108,785
Austrians
98.5
/100
|
#86
Exceptional
$108,692
Tongans
98.5
/100
|
#87
Exceptional
$108,643
Romanians
98.5
/100
|
#88
Exceptional
$108,609
Ukrainians
98.3
/100
|
#89
Exceptional
$108,475
Immigrants | Philippines
98.3
/100
|
#90
Exceptional
$108,471

Demographics Similar to Immigrants from Guyana by Householder Income Ages 45 - 64 years

In terms of householder income ages 45 - 64 years, the demographic groups most similar to Immigrants from Guyana are Barbadian ($90,266, a difference of 0.090%), Marshallese ($90,455, a difference of 0.30%), West Indian ($89,906, a difference of 0.31%), American ($90,536, a difference of 0.39%), and French American Indian ($89,811, a difference of 0.42%).
DemographicsRating | RankHouseholder Income Ages 45 - 64 years
Alaskan Athabascans
0.9
/100
|
#247
Tragic
$90,951
Immigrants | Laos
0.9
/100
|
#248
Tragic
$90,909
Mexican American Indians
0.8
/100
|
#249
Tragic
$90,811
Sub-Saharan Africans
0.8
/100
|
#250
Tragic
$90,691
Americans
0.7
/100
|
#251
Tragic
$90,536
Marshallese
0.7
/100
|
#252
Tragic
$90,455
Barbadians
0.6
/100
|
#253
Tragic
$90,266
Immigrants | Guyana
0.6
/100
|
#254
Tragic
$90,186
West Indians
0.5
/100
|
#255
Tragic
$89,906
French American Indians
0.5
/100
|
#256
Tragic
$89,811
German Russians
0.4
/100
|
#257
Tragic
$89,398
Immigrants | Barbados
0.4
/100
|
#258
Tragic
$89,394
Immigrants | Nicaragua
0.4
/100
|
#259
Tragic
$89,108
Liberians
0.3
/100
|
#260
Tragic
$88,929
Belizeans
0.3
/100
|
#261
Tragic
$88,684