Immigrants from South Central Asia vs Slavic Householder Income Ages 45 - 64 years
COMPARE
Immigrants from South Central Asia
Slavic
Householder Income Ages 45 - 64 years
Householder Income Ages 45 - 64 years Comparison
Immigrants from South Central Asia
Slavs
$124,188
HOUSEHOLDER INCOME AGES 45 - 64 YEARS
100.0/ 100
METRIC RATING
10th/ 347
METRIC RANK
$102,629
HOUSEHOLDER INCOME AGES 45 - 64 YEARS
76.1/ 100
METRIC RATING
158th/ 347
METRIC RANK
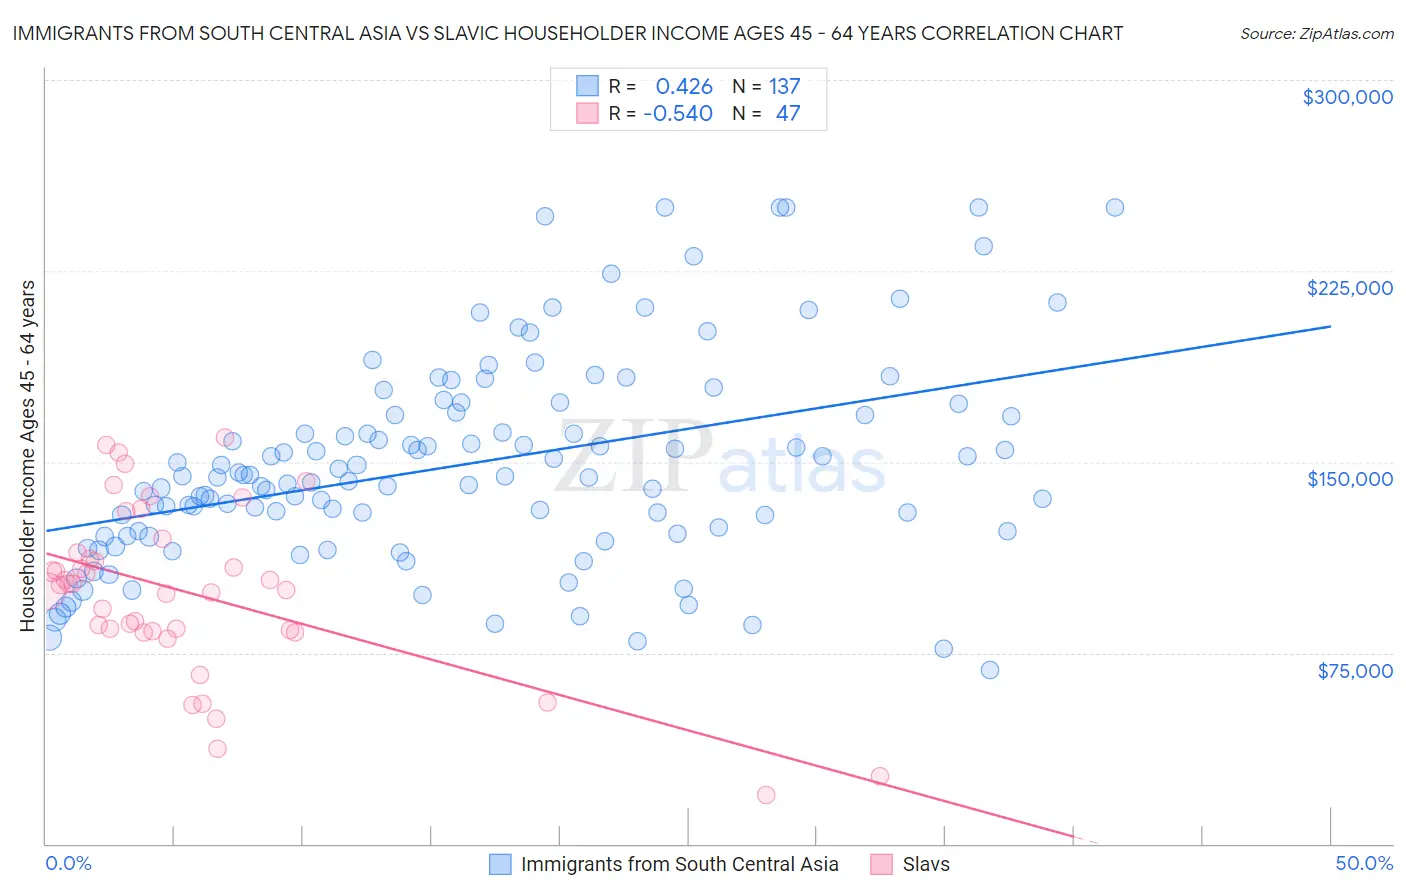
Immigrants from South Central Asia vs Slavic Householder Income Ages 45 - 64 years Correlation Chart
The statistical analysis conducted on geographies consisting of 471,929,407 people shows a moderate positive correlation between the proportion of Immigrants from South Central Asia and household income with householder between the ages 45 and 64 in the United States with a correlation coefficient (R) of 0.426 and weighted average of $124,188. Similarly, the statistical analysis conducted on geographies consisting of 270,616,686 people shows a substantial negative correlation between the proportion of Slavs and household income with householder between the ages 45 and 64 in the United States with a correlation coefficient (R) of -0.540 and weighted average of $102,629, a difference of 21.0%.
Householder Income Ages 45 - 64 years Correlation Summary
| Measurement | Immigrants from South Central Asia | Slavic |
| Minimum | $68,125 | $18,979 |
| Maximum | $250,001 | $159,583 |
| Range | $181,876 | $140,604 |
| Mean | $148,894 | $98,663 |
| Median | $144,037 | $101,881 |
| Interquartile 25% (IQ1) | $122,225 | $83,250 |
| Interquartile 75% (IQ3) | $168,955 | $114,292 |
| Interquartile Range (IQR) | $46,731 | $31,042 |
| Standard Deviation (Sample) | $40,252 | $32,811 |
| Standard Deviation (Population) | $40,105 | $32,460 |
Similar Demographics by Householder Income Ages 45 - 64 years
Demographics Similar to Immigrants from South Central Asia by Householder Income Ages 45 - 64 years
In terms of householder income ages 45 - 64 years, the demographic groups most similar to Immigrants from South Central Asia are Okinawan ($124,796, a difference of 0.49%), Cypriot ($123,396, a difference of 0.64%), Immigrants from Israel ($122,893, a difference of 1.1%), Immigrants from Ireland ($122,757, a difference of 1.2%), and Indian (Asian) ($122,343, a difference of 1.5%).
| Demographics | Rating | Rank | Householder Income Ages 45 - 64 years |
| Immigrants | India | 100.0 /100 | #3 | Exceptional $132,488 |
| Thais | 100.0 /100 | #4 | Exceptional $129,560 |
| Immigrants | Singapore | 100.0 /100 | #5 | Exceptional $129,514 |
| Iranians | 100.0 /100 | #6 | Exceptional $129,350 |
| Immigrants | Hong Kong | 100.0 /100 | #7 | Exceptional $127,500 |
| Immigrants | Iran | 100.0 /100 | #8 | Exceptional $126,940 |
| Okinawans | 100.0 /100 | #9 | Exceptional $124,796 |
| Immigrants | South Central Asia | 100.0 /100 | #10 | Exceptional $124,188 |
| Cypriots | 100.0 /100 | #11 | Exceptional $123,396 |
| Immigrants | Israel | 100.0 /100 | #12 | Exceptional $122,893 |
| Immigrants | Ireland | 100.0 /100 | #13 | Exceptional $122,757 |
| Indians (Asian) | 100.0 /100 | #14 | Exceptional $122,343 |
| Immigrants | Eastern Asia | 100.0 /100 | #15 | Exceptional $122,222 |
| Immigrants | China | 100.0 /100 | #16 | Exceptional $122,178 |
| Burmese | 100.0 /100 | #17 | Exceptional $121,444 |
Demographics Similar to Slavs by Householder Income Ages 45 - 64 years
In terms of householder income ages 45 - 64 years, the demographic groups most similar to Slavs are Immigrants from Ethiopia ($102,763, a difference of 0.13%), Carpatho Rusyn ($102,777, a difference of 0.14%), Costa Rican ($102,779, a difference of 0.15%), Sierra Leonean ($102,427, a difference of 0.20%), and Slovene ($102,885, a difference of 0.25%).
| Demographics | Rating | Rank | Householder Income Ages 45 - 64 years |
| Swiss | 79.9 /100 | #151 | Good $103,071 |
| Irish | 79.8 /100 | #152 | Good $103,067 |
| Scandinavians | 79.0 /100 | #153 | Good $102,969 |
| Slovenes | 78.3 /100 | #154 | Good $102,885 |
| Costa Ricans | 77.4 /100 | #155 | Good $102,779 |
| Carpatho Rusyns | 77.4 /100 | #156 | Good $102,777 |
| Immigrants | Ethiopia | 77.3 /100 | #157 | Good $102,763 |
| Slavs | 76.1 /100 | #158 | Good $102,629 |
| Sierra Leoneans | 74.2 /100 | #159 | Good $102,427 |
| Icelanders | 72.5 /100 | #160 | Good $102,261 |
| Immigrants | Nepal | 71.8 /100 | #161 | Good $102,190 |
| Scottish | 71.1 /100 | #162 | Good $102,123 |
| English | 70.1 /100 | #163 | Good $102,021 |
| Immigrants | Morocco | 70.0 /100 | #164 | Good $102,015 |
| Immigrants | Albania | 69.4 /100 | #165 | Good $101,957 |