Immigrants from South Central Asia vs Venezuelan Householder Income Ages 45 - 64 years
COMPARE
Immigrants from South Central Asia
Venezuelan
Householder Income Ages 45 - 64 years
Householder Income Ages 45 - 64 years Comparison
Immigrants from South Central Asia
Venezuelans
$124,188
HOUSEHOLDER INCOME AGES 45 - 64 YEARS
100.0/ 100
METRIC RATING
10th/ 347
METRIC RANK
$96,460
HOUSEHOLDER INCOME AGES 45 - 64 YEARS
12.6/ 100
METRIC RATING
212th/ 347
METRIC RANK
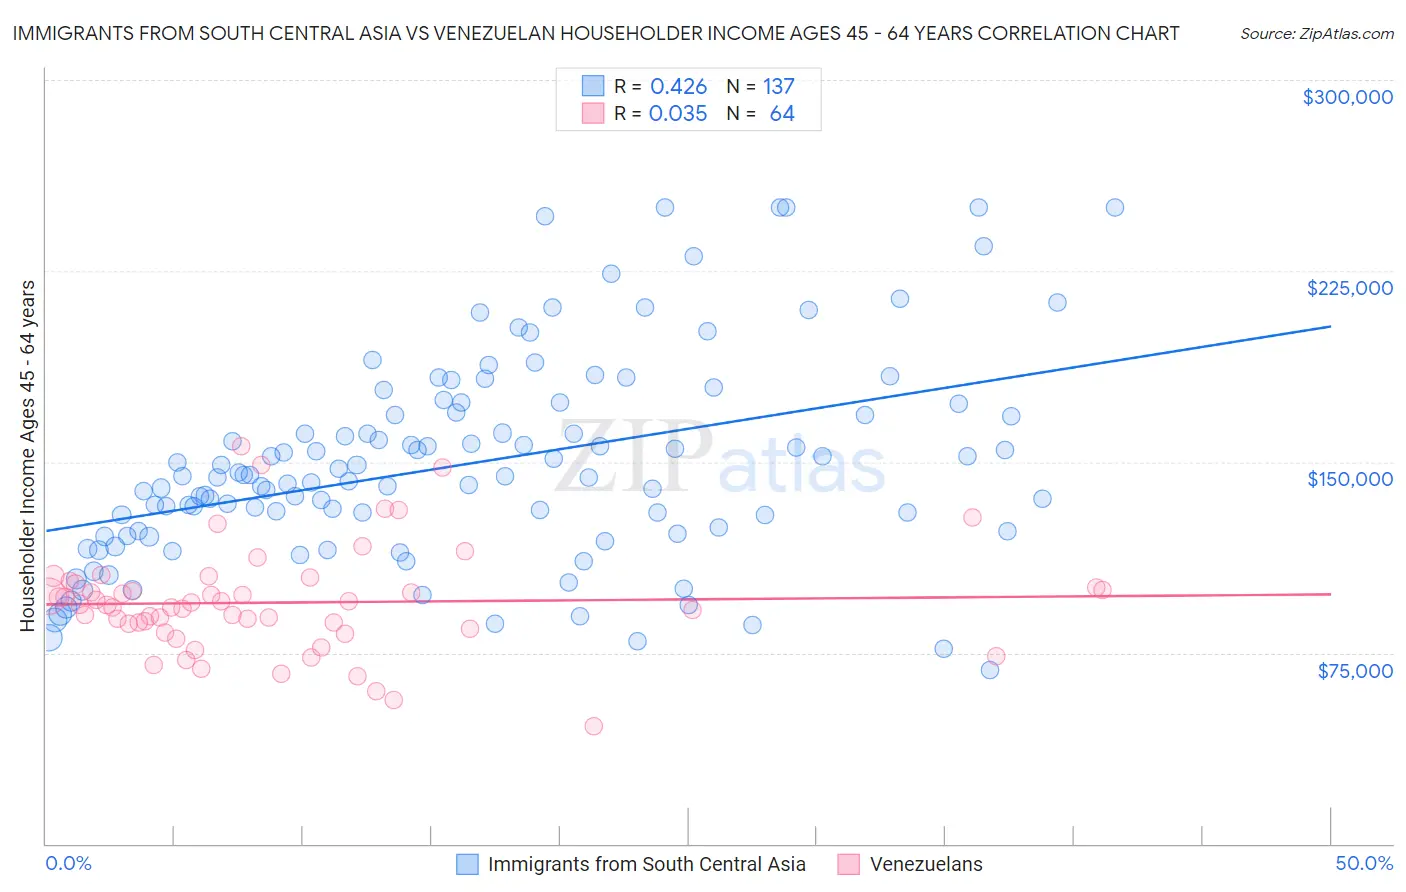
Immigrants from South Central Asia vs Venezuelan Householder Income Ages 45 - 64 years Correlation Chart
The statistical analysis conducted on geographies consisting of 471,929,407 people shows a moderate positive correlation between the proportion of Immigrants from South Central Asia and household income with householder between the ages 45 and 64 in the United States with a correlation coefficient (R) of 0.426 and weighted average of $124,188. Similarly, the statistical analysis conducted on geographies consisting of 305,898,329 people shows no correlation between the proportion of Venezuelans and household income with householder between the ages 45 and 64 in the United States with a correlation coefficient (R) of 0.035 and weighted average of $96,460, a difference of 28.7%.
Householder Income Ages 45 - 64 years Correlation Summary
| Measurement | Immigrants from South Central Asia | Venezuelan |
| Minimum | $68,125 | $46,250 |
| Maximum | $250,001 | $155,899 |
| Range | $181,876 | $109,649 |
| Mean | $148,894 | $94,776 |
| Median | $144,037 | $94,033 |
| Interquartile 25% (IQ1) | $122,225 | $85,499 |
| Interquartile 75% (IQ3) | $168,955 | $101,274 |
| Interquartile Range (IQR) | $46,731 | $15,775 |
| Standard Deviation (Sample) | $40,252 | $20,798 |
| Standard Deviation (Population) | $40,105 | $20,635 |
Similar Demographics by Householder Income Ages 45 - 64 years
Demographics Similar to Immigrants from South Central Asia by Householder Income Ages 45 - 64 years
In terms of householder income ages 45 - 64 years, the demographic groups most similar to Immigrants from South Central Asia are Okinawan ($124,796, a difference of 0.49%), Cypriot ($123,396, a difference of 0.64%), Immigrants from Israel ($122,893, a difference of 1.1%), Immigrants from Ireland ($122,757, a difference of 1.2%), and Indian (Asian) ($122,343, a difference of 1.5%).
| Demographics | Rating | Rank | Householder Income Ages 45 - 64 years |
| Immigrants | India | 100.0 /100 | #3 | Exceptional $132,488 |
| Thais | 100.0 /100 | #4 | Exceptional $129,560 |
| Immigrants | Singapore | 100.0 /100 | #5 | Exceptional $129,514 |
| Iranians | 100.0 /100 | #6 | Exceptional $129,350 |
| Immigrants | Hong Kong | 100.0 /100 | #7 | Exceptional $127,500 |
| Immigrants | Iran | 100.0 /100 | #8 | Exceptional $126,940 |
| Okinawans | 100.0 /100 | #9 | Exceptional $124,796 |
| Immigrants | South Central Asia | 100.0 /100 | #10 | Exceptional $124,188 |
| Cypriots | 100.0 /100 | #11 | Exceptional $123,396 |
| Immigrants | Israel | 100.0 /100 | #12 | Exceptional $122,893 |
| Immigrants | Ireland | 100.0 /100 | #13 | Exceptional $122,757 |
| Indians (Asian) | 100.0 /100 | #14 | Exceptional $122,343 |
| Immigrants | Eastern Asia | 100.0 /100 | #15 | Exceptional $122,222 |
| Immigrants | China | 100.0 /100 | #16 | Exceptional $122,178 |
| Burmese | 100.0 /100 | #17 | Exceptional $121,444 |
Demographics Similar to Venezuelans by Householder Income Ages 45 - 64 years
In terms of householder income ages 45 - 64 years, the demographic groups most similar to Venezuelans are Immigrants from Cambodia ($96,537, a difference of 0.080%), Tsimshian ($96,783, a difference of 0.34%), Japanese ($96,834, a difference of 0.39%), Immigrants from Uruguay ($96,086, a difference of 0.39%), and Panamanian ($96,066, a difference of 0.41%).
| Demographics | Rating | Rank | Householder Income Ages 45 - 64 years |
| Immigrants | Colombia | 18.0 /100 | #205 | Poor $97,290 |
| Immigrants | Africa | 17.9 /100 | #206 | Poor $97,284 |
| Ghanaians | 17.9 /100 | #207 | Poor $97,277 |
| Scotch-Irish | 16.4 /100 | #208 | Poor $97,073 |
| Japanese | 14.8 /100 | #209 | Poor $96,834 |
| Tsimshian | 14.5 /100 | #210 | Poor $96,783 |
| Immigrants | Cambodia | 13.0 /100 | #211 | Poor $96,537 |
| Venezuelans | 12.6 /100 | #212 | Poor $96,460 |
| Immigrants | Uruguay | 10.7 /100 | #213 | Poor $96,086 |
| Panamanians | 10.6 /100 | #214 | Poor $96,066 |
| Nigerians | 8.2 /100 | #215 | Tragic $95,492 |
| Immigrants | Venezuela | 7.6 /100 | #216 | Tragic $95,342 |
| Immigrants | Ghana | 6.4 /100 | #217 | Tragic $94,982 |
| Delaware | 6.2 /100 | #218 | Tragic $94,914 |
| Immigrants | Armenia | 6.1 /100 | #219 | Tragic $94,863 |