Immigrants from South Central Asia vs Spanish American Median Household Income
COMPARE
Immigrants from South Central Asia
Spanish American
Median Household Income
Median Household Income Comparison
Immigrants from South Central Asia
Spanish Americans
$106,057
MEDIAN HOUSEHOLD INCOME
100.0/ 100
METRIC RATING
10th/ 347
METRIC RANK
$75,386
MEDIAN HOUSEHOLD INCOME
0.2/ 100
METRIC RATING
277th/ 347
METRIC RANK
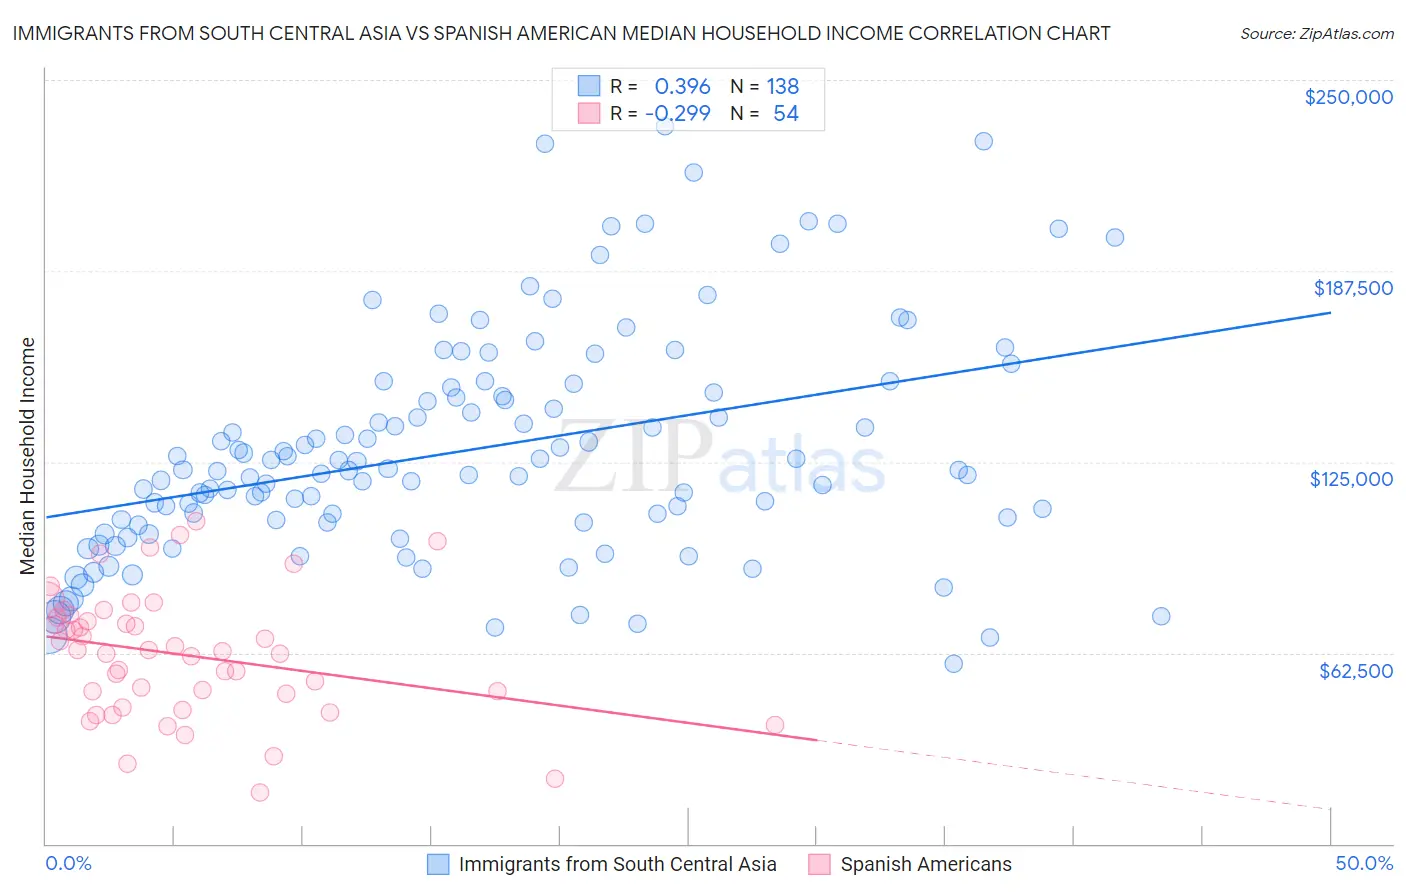
Immigrants from South Central Asia vs Spanish American Median Household Income Correlation Chart
The statistical analysis conducted on geographies consisting of 472,541,565 people shows a mild positive correlation between the proportion of Immigrants from South Central Asia and median household income in the United States with a correlation coefficient (R) of 0.396 and weighted average of $106,057. Similarly, the statistical analysis conducted on geographies consisting of 103,163,457 people shows a weak negative correlation between the proportion of Spanish Americans and median household income in the United States with a correlation coefficient (R) of -0.299 and weighted average of $75,386, a difference of 40.7%.
Median Household Income Correlation Summary
| Measurement | Immigrants from South Central Asia | Spanish American |
| Minimum | $58,750 | $16,806 |
| Maximum | $234,750 | $105,648 |
| Range | $176,000 | $88,842 |
| Mean | $128,797 | $61,918 |
| Median | $122,210 | $63,227 |
| Interquartile 25% (IQ1) | $105,243 | $49,158 |
| Interquartile 75% (IQ3) | $147,699 | $74,166 |
| Interquartile Range (IQR) | $42,456 | $25,008 |
| Standard Deviation (Sample) | $36,764 | $20,311 |
| Standard Deviation (Population) | $36,630 | $20,122 |
Similar Demographics by Median Household Income
Demographics Similar to Immigrants from South Central Asia by Median Household Income
In terms of median household income, the demographic groups most similar to Immigrants from South Central Asia are Okinawan ($106,624, a difference of 0.53%), Immigrants from China ($105,335, a difference of 0.69%), Indian (Asian) ($105,262, a difference of 0.76%), Immigrants from Eastern Asia ($104,796, a difference of 1.2%), and Immigrants from Ireland ($104,692, a difference of 1.3%).
| Demographics | Rating | Rank | Median Household Income |
| Immigrants | India | 100.0 /100 | #3 | Exceptional $113,009 |
| Immigrants | Hong Kong | 100.0 /100 | #4 | Exceptional $111,519 |
| Thais | 100.0 /100 | #5 | Exceptional $110,648 |
| Immigrants | Singapore | 100.0 /100 | #6 | Exceptional $110,428 |
| Iranians | 100.0 /100 | #7 | Exceptional $109,835 |
| Immigrants | Iran | 100.0 /100 | #8 | Exceptional $108,055 |
| Okinawans | 100.0 /100 | #9 | Exceptional $106,624 |
| Immigrants | South Central Asia | 100.0 /100 | #10 | Exceptional $106,057 |
| Immigrants | China | 100.0 /100 | #11 | Exceptional $105,335 |
| Indians (Asian) | 100.0 /100 | #12 | Exceptional $105,262 |
| Immigrants | Eastern Asia | 100.0 /100 | #13 | Exceptional $104,796 |
| Immigrants | Ireland | 100.0 /100 | #14 | Exceptional $104,692 |
| Immigrants | Israel | 100.0 /100 | #15 | Exceptional $104,090 |
| Burmese | 100.0 /100 | #16 | Exceptional $103,145 |
| Immigrants | Korea | 100.0 /100 | #17 | Exceptional $102,962 |
Demographics Similar to Spanish Americans by Median Household Income
In terms of median household income, the demographic groups most similar to Spanish Americans are Immigrants from Latin America ($75,420, a difference of 0.040%), Osage ($75,240, a difference of 0.19%), Immigrants from Micronesia ($75,574, a difference of 0.25%), British West Indian ($75,647, a difference of 0.35%), and Immigrants from Guatemala ($75,123, a difference of 0.35%).
| Demographics | Rating | Rank | Median Household Income |
| Hmong | 0.3 /100 | #270 | Tragic $75,839 |
| Pennsylvania Germans | 0.3 /100 | #271 | Tragic $75,814 |
| Somalis | 0.3 /100 | #272 | Tragic $75,782 |
| Liberians | 0.2 /100 | #273 | Tragic $75,667 |
| British West Indians | 0.2 /100 | #274 | Tragic $75,647 |
| Immigrants | Micronesia | 0.2 /100 | #275 | Tragic $75,574 |
| Immigrants | Latin America | 0.2 /100 | #276 | Tragic $75,420 |
| Spanish Americans | 0.2 /100 | #277 | Tragic $75,386 |
| Osage | 0.2 /100 | #278 | Tragic $75,240 |
| Immigrants | Guatemala | 0.2 /100 | #279 | Tragic $75,123 |
| Senegalese | 0.2 /100 | #280 | Tragic $74,999 |
| Immigrants | Liberia | 0.1 /100 | #281 | Tragic $74,896 |
| Central American Indians | 0.1 /100 | #282 | Tragic $74,847 |
| Cree | 0.1 /100 | #283 | Tragic $74,685 |
| Yaqui | 0.1 /100 | #284 | Tragic $74,596 |