Immigrants from South America vs Ugandan 4th Grade
COMPARE
Immigrants from South America
Ugandan
4th Grade
4th Grade Comparison
Immigrants from South America
Ugandans
97.0%
4TH GRADE
0.4/ 100
METRIC RATING
261st/ 347
METRIC RANK
97.6%
4TH GRADE
58.9/ 100
METRIC RATING
164th/ 347
METRIC RANK
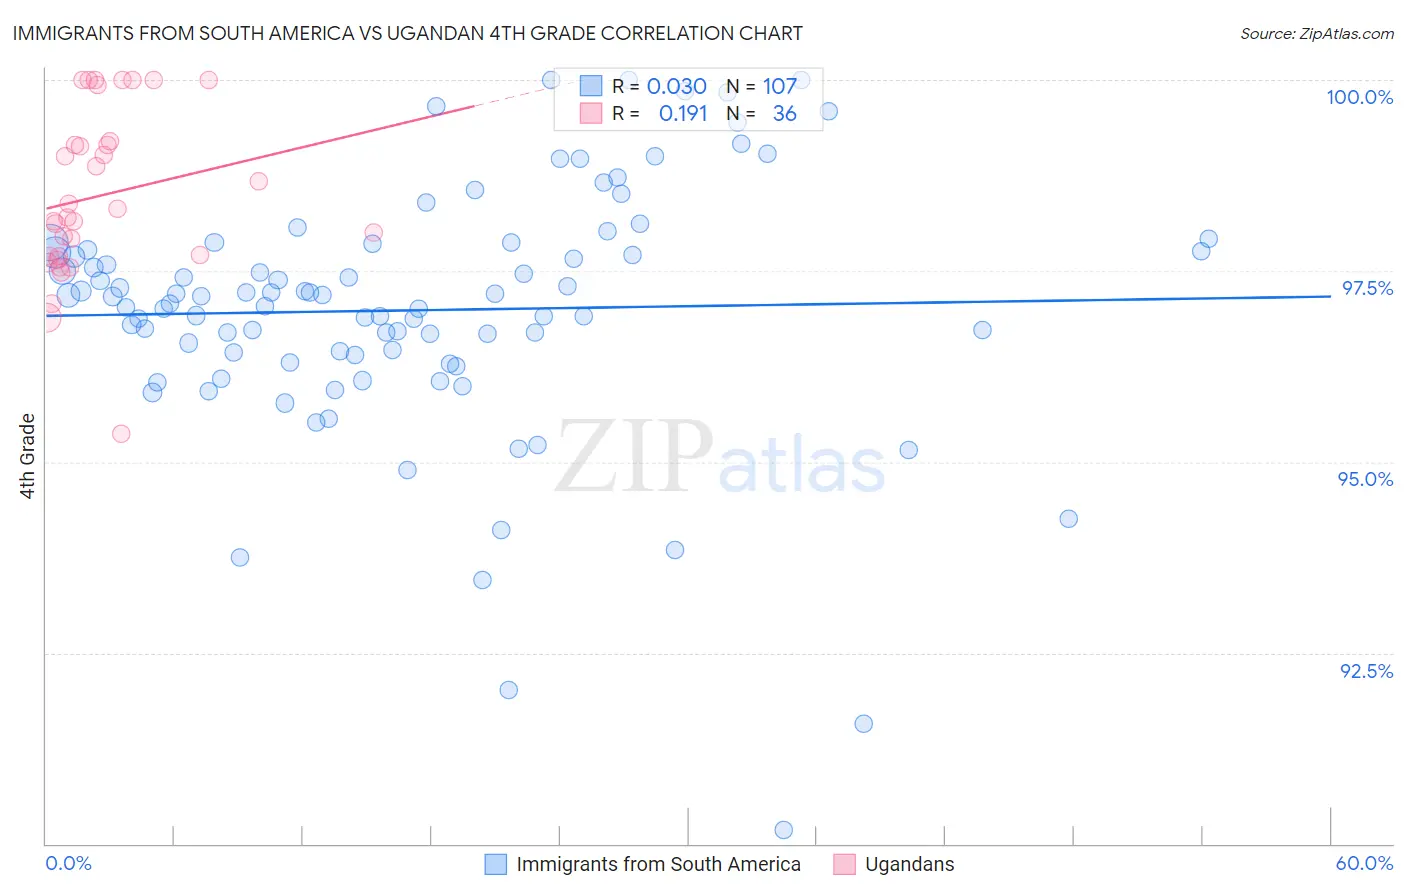
Immigrants from South America vs Ugandan 4th Grade Correlation Chart
The statistical analysis conducted on geographies consisting of 486,429,719 people shows no correlation between the proportion of Immigrants from South America and percentage of population with at least 4th grade education in the United States with a correlation coefficient (R) of 0.030 and weighted average of 97.0%. Similarly, the statistical analysis conducted on geographies consisting of 93,991,892 people shows a poor positive correlation between the proportion of Ugandans and percentage of population with at least 4th grade education in the United States with a correlation coefficient (R) of 0.191 and weighted average of 97.6%, a difference of 0.56%.
4th Grade Correlation Summary
| Measurement | Immigrants from South America | Ugandan |
| Minimum | 90.2% | 95.4% |
| Maximum | 100.0% | 100.0% |
| Range | 9.8% | 4.6% |
| Mean | 97.0% | 98.5% |
| Median | 97.2% | 98.3% |
| Interquartile 25% (IQ1) | 96.4% | 97.7% |
| Interquartile 75% (IQ3) | 97.8% | 99.2% |
| Interquartile Range (IQR) | 1.4% | 1.5% |
| Standard Deviation (Sample) | 1.7% | 1.1% |
| Standard Deviation (Population) | 1.6% | 1.1% |
Similar Demographics by 4th Grade
Demographics Similar to Immigrants from South America by 4th Grade
In terms of 4th grade, the demographic groups most similar to Immigrants from South America are Immigrants from Sierra Leone (97.0%, a difference of 0.0%), West Indian (97.0%, a difference of 0.010%), Immigrants from Jamaica (97.0%, a difference of 0.010%), Immigrants from Congo (97.0%, a difference of 0.020%), and Immigrants from Colombia (97.0%, a difference of 0.020%).
| Demographics | Rating | Rank | 4th Grade |
| Immigrants | Middle Africa | 0.8 /100 | #254 | Tragic 97.1% |
| Peruvians | 0.7 /100 | #255 | Tragic 97.1% |
| Bolivians | 0.7 /100 | #256 | Tragic 97.1% |
| Immigrants | Congo | 0.5 /100 | #257 | Tragic 97.0% |
| Immigrants | Colombia | 0.5 /100 | #258 | Tragic 97.0% |
| Immigrants | Ethiopia | 0.4 /100 | #259 | Tragic 97.0% |
| Immigrants | Sierra Leone | 0.4 /100 | #260 | Tragic 97.0% |
| Immigrants | South America | 0.4 /100 | #261 | Tragic 97.0% |
| West Indians | 0.4 /100 | #262 | Tragic 97.0% |
| Immigrants | Jamaica | 0.3 /100 | #263 | Tragic 97.0% |
| Taiwanese | 0.3 /100 | #264 | Tragic 97.0% |
| Armenians | 0.3 /100 | #265 | Tragic 97.0% |
| Immigrants | China | 0.3 /100 | #266 | Tragic 97.0% |
| Immigrants | Nigeria | 0.3 /100 | #267 | Tragic 97.0% |
| Ghanaians | 0.2 /100 | #268 | Tragic 97.0% |
Demographics Similar to Ugandans by 4th Grade
In terms of 4th grade, the demographic groups most similar to Ugandans are Venezuelan (97.6%, a difference of 0.0%), Apache (97.6%, a difference of 0.010%), Marshallese (97.6%, a difference of 0.010%), Bermudan (97.6%, a difference of 0.010%), and Immigrants from Iran (97.6%, a difference of 0.010%).
| Demographics | Rating | Rank | 4th Grade |
| Immigrants | Bosnia and Herzegovina | 66.0 /100 | #157 | Good 97.6% |
| French American Indians | 65.9 /100 | #158 | Good 97.6% |
| Immigrants | Italy | 63.7 /100 | #159 | Good 97.6% |
| Apache | 61.3 /100 | #160 | Good 97.6% |
| Marshallese | 60.8 /100 | #161 | Good 97.6% |
| Bermudans | 60.5 /100 | #162 | Good 97.6% |
| Immigrants | Iran | 60.3 /100 | #163 | Good 97.6% |
| Ugandans | 58.9 /100 | #164 | Average 97.6% |
| Venezuelans | 58.7 /100 | #165 | Average 97.6% |
| Kenyans | 56.5 /100 | #166 | Average 97.5% |
| Immigrants | Poland | 55.9 /100 | #167 | Average 97.5% |
| Immigrants | Belarus | 55.8 /100 | #168 | Average 97.5% |
| Chileans | 54.4 /100 | #169 | Average 97.5% |
| Immigrants | Spain | 51.8 /100 | #170 | Average 97.5% |
| Brazilians | 51.5 /100 | #171 | Average 97.5% |