Immigrants from South America vs Immigrants from Jordan Householder Income Over 65 years
COMPARE
Immigrants from South America
Immigrants from Jordan
Householder Income Over 65 years
Householder Income Over 65 years Comparison
Immigrants from South America
Immigrants from Jordan
$59,151
HOUSEHOLDER INCOME OVER 65 YEARS
13.0/ 100
METRIC RATING
206th/ 347
METRIC RANK
$63,041
HOUSEHOLDER INCOME OVER 65 YEARS
89.8/ 100
METRIC RATING
119th/ 347
METRIC RANK
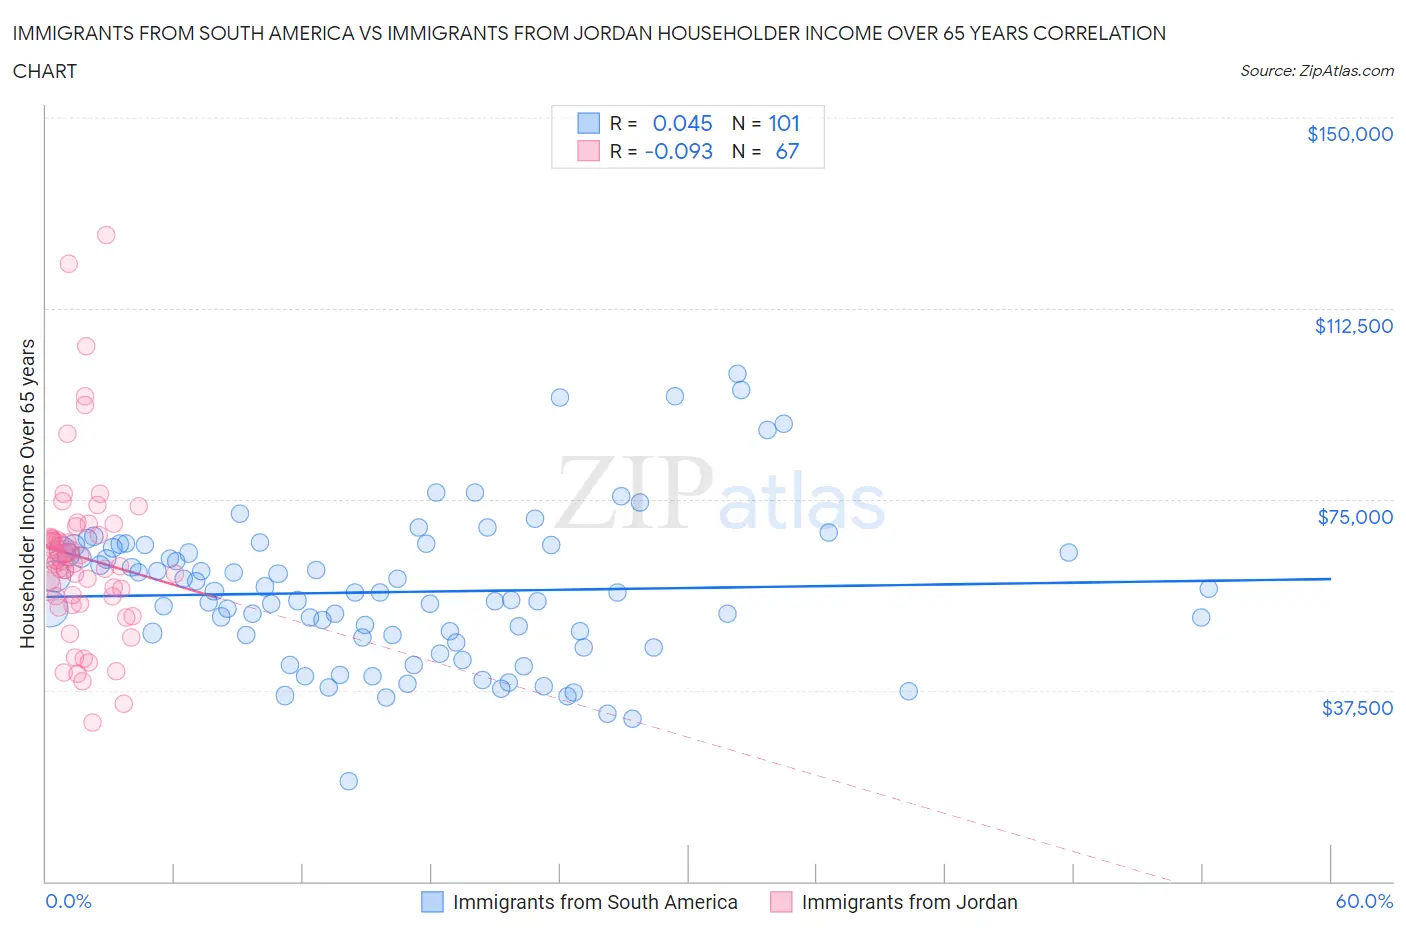
Immigrants from South America vs Immigrants from Jordan Householder Income Over 65 years Correlation Chart
The statistical analysis conducted on geographies consisting of 483,931,115 people shows no correlation between the proportion of Immigrants from South America and household income with householder over the age of 65 in the United States with a correlation coefficient (R) of 0.045 and weighted average of $59,151. Similarly, the statistical analysis conducted on geographies consisting of 181,136,935 people shows a slight negative correlation between the proportion of Immigrants from Jordan and household income with householder over the age of 65 in the United States with a correlation coefficient (R) of -0.093 and weighted average of $63,041, a difference of 6.6%.
Householder Income Over 65 years Correlation Summary
| Measurement | Immigrants from South America | Immigrants from Jordan |
| Minimum | $19,690 | $31,244 |
| Maximum | $99,659 | $126,912 |
| Range | $79,969 | $95,668 |
| Mean | $56,812 | $63,669 |
| Median | $56,602 | $62,862 |
| Interquartile 25% (IQ1) | $47,443 | $55,944 |
| Interquartile 75% (IQ3) | $65,274 | $67,482 |
| Interquartile Range (IQR) | $17,831 | $11,537 |
| Standard Deviation (Sample) | $14,727 | $16,989 |
| Standard Deviation (Population) | $14,654 | $16,862 |
Similar Demographics by Householder Income Over 65 years
Demographics Similar to Immigrants from South America by Householder Income Over 65 years
In terms of householder income over 65 years, the demographic groups most similar to Immigrants from South America are Salvadoran ($59,141, a difference of 0.020%), Uruguayan ($59,090, a difference of 0.10%), Immigrants from Sudan ($59,248, a difference of 0.16%), Slovak ($59,039, a difference of 0.19%), and Nigerian ($58,992, a difference of 0.27%).
| Demographics | Rating | Rank | Householder Income Over 65 years |
| Immigrants | Immigrants | 20.2 /100 | #199 | Fair $59,656 |
| French | 20.2 /100 | #200 | Fair $59,656 |
| Dutch | 18.3 /100 | #201 | Poor $59,539 |
| Finns | 18.2 /100 | #202 | Poor $59,535 |
| Scotch-Irish | 16.9 /100 | #203 | Poor $59,447 |
| Arapaho | 16.0 /100 | #204 | Poor $59,383 |
| Immigrants | Sudan | 14.2 /100 | #205 | Poor $59,248 |
| Immigrants | South America | 13.0 /100 | #206 | Poor $59,151 |
| Salvadorans | 12.9 /100 | #207 | Poor $59,141 |
| Uruguayans | 12.3 /100 | #208 | Poor $59,090 |
| Slovaks | 11.7 /100 | #209 | Poor $59,039 |
| Nigerians | 11.2 /100 | #210 | Poor $58,992 |
| Immigrants | Nigeria | 10.7 /100 | #211 | Poor $58,942 |
| Colombians | 9.8 /100 | #212 | Tragic $58,851 |
| Whites/Caucasians | 9.8 /100 | #213 | Tragic $58,847 |
Demographics Similar to Immigrants from Jordan by Householder Income Over 65 years
In terms of householder income over 65 years, the demographic groups most similar to Immigrants from Jordan are Ukrainian ($63,032, a difference of 0.010%), Immigrants from Vietnam ($63,014, a difference of 0.040%), Danish ($63,117, a difference of 0.12%), Immigrants from Moldova ($62,939, a difference of 0.16%), and Tlingit-Haida ($62,922, a difference of 0.19%).
| Demographics | Rating | Rank | Householder Income Over 65 years |
| Syrians | 93.4 /100 | #112 | Exceptional $63,494 |
| Immigrants | Serbia | 92.7 /100 | #113 | Exceptional $63,387 |
| Immigrants | Saudi Arabia | 92.4 /100 | #114 | Exceptional $63,355 |
| Croatians | 91.4 /100 | #115 | Exceptional $63,225 |
| Guamanians/Chamorros | 91.1 /100 | #116 | Exceptional $63,187 |
| Immigrants | Croatia | 90.9 /100 | #117 | Exceptional $63,168 |
| Danes | 90.5 /100 | #118 | Exceptional $63,117 |
| Immigrants | Jordan | 89.8 /100 | #119 | Excellent $63,041 |
| Ukrainians | 89.7 /100 | #120 | Excellent $63,032 |
| Immigrants | Vietnam | 89.5 /100 | #121 | Excellent $63,014 |
| Immigrants | Moldova | 88.7 /100 | #122 | Excellent $62,939 |
| Tlingit-Haida | 88.6 /100 | #123 | Excellent $62,922 |
| Taiwanese | 88.3 /100 | #124 | Excellent $62,894 |
| Soviet Union | 87.8 /100 | #125 | Excellent $62,848 |
| Peruvians | 86.8 /100 | #126 | Excellent $62,766 |