Immigrants from South America vs Slovak Householder Income Over 65 years
COMPARE
Immigrants from South America
Slovak
Householder Income Over 65 years
Householder Income Over 65 years Comparison
Immigrants from South America
Slovaks
$59,151
HOUSEHOLDER INCOME OVER 65 YEARS
13.0/ 100
METRIC RATING
206th/ 347
METRIC RANK
$59,039
HOUSEHOLDER INCOME OVER 65 YEARS
11.7/ 100
METRIC RATING
209th/ 347
METRIC RANK
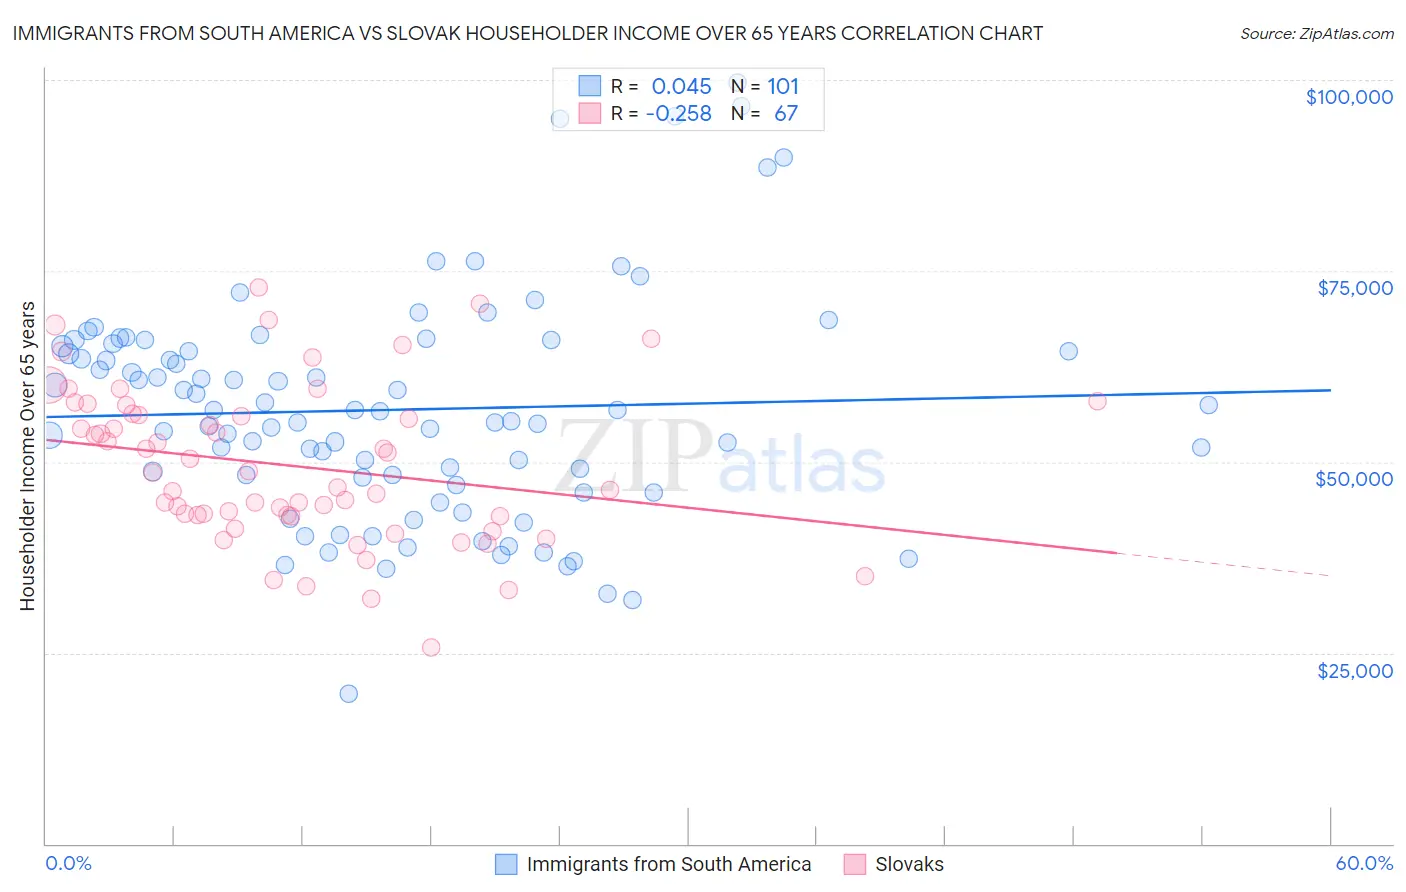
Immigrants from South America vs Slovak Householder Income Over 65 years Correlation Chart
The statistical analysis conducted on geographies consisting of 483,931,115 people shows no correlation between the proportion of Immigrants from South America and household income with householder over the age of 65 in the United States with a correlation coefficient (R) of 0.045 and weighted average of $59,151. Similarly, the statistical analysis conducted on geographies consisting of 396,632,893 people shows a weak negative correlation between the proportion of Slovaks and household income with householder over the age of 65 in the United States with a correlation coefficient (R) of -0.258 and weighted average of $59,039, a difference of 0.19%.
Householder Income Over 65 years Correlation Summary
| Measurement | Immigrants from South America | Slovak |
| Minimum | $19,690 | $25,719 |
| Maximum | $99,659 | $72,768 |
| Range | $79,969 | $47,049 |
| Mean | $56,812 | $49,485 |
| Median | $56,602 | $48,589 |
| Interquartile 25% (IQ1) | $47,443 | $42,955 |
| Interquartile 75% (IQ3) | $65,274 | $56,267 |
| Interquartile Range (IQR) | $17,831 | $13,312 |
| Standard Deviation (Sample) | $14,727 | $10,187 |
| Standard Deviation (Population) | $14,654 | $10,111 |
Demographics Similar to Immigrants from South America and Slovaks by Householder Income Over 65 years
In terms of householder income over 65 years, the demographic groups most similar to Immigrants from South America are Salvadoran ($59,141, a difference of 0.020%), Uruguayan ($59,090, a difference of 0.10%), Immigrants from Sudan ($59,248, a difference of 0.16%), Nigerian ($58,992, a difference of 0.27%), and Immigrants from Nigeria ($58,942, a difference of 0.35%). Similarly, the demographic groups most similar to Slovaks are Nigerian ($58,992, a difference of 0.080%), Uruguayan ($59,090, a difference of 0.090%), Immigrants from Nigeria ($58,942, a difference of 0.16%), Salvadoran ($59,141, a difference of 0.17%), and Colombian ($58,851, a difference of 0.32%).
| Demographics | Rating | Rank | Householder Income Over 65 years |
| Immigrants | Kenya | 21.1 /100 | #197 | Fair $59,710 |
| Moroccans | 20.7 /100 | #198 | Fair $59,683 |
| Immigrants | Immigrants | 20.2 /100 | #199 | Fair $59,656 |
| French | 20.2 /100 | #200 | Fair $59,656 |
| Dutch | 18.3 /100 | #201 | Poor $59,539 |
| Finns | 18.2 /100 | #202 | Poor $59,535 |
| Scotch-Irish | 16.9 /100 | #203 | Poor $59,447 |
| Arapaho | 16.0 /100 | #204 | Poor $59,383 |
| Immigrants | Sudan | 14.2 /100 | #205 | Poor $59,248 |
| Immigrants | South America | 13.0 /100 | #206 | Poor $59,151 |
| Salvadorans | 12.9 /100 | #207 | Poor $59,141 |
| Uruguayans | 12.3 /100 | #208 | Poor $59,090 |
| Slovaks | 11.7 /100 | #209 | Poor $59,039 |
| Nigerians | 11.2 /100 | #210 | Poor $58,992 |
| Immigrants | Nigeria | 10.7 /100 | #211 | Poor $58,942 |
| Colombians | 9.8 /100 | #212 | Tragic $58,851 |
| Whites/Caucasians | 9.8 /100 | #213 | Tragic $58,847 |
| Nepalese | 9.0 /100 | #214 | Tragic $58,761 |
| Immigrants | Ghana | 7.9 /100 | #215 | Tragic $58,624 |
| Immigrants | Middle Africa | 6.2 /100 | #216 | Tragic $58,375 |
| Sudanese | 5.7 /100 | #217 | Tragic $58,281 |