Immigrants from South America vs Immigrants from Nepal Householder Income Over 65 years
COMPARE
Immigrants from South America
Immigrants from Nepal
Householder Income Over 65 years
Householder Income Over 65 years Comparison
Immigrants from South America
Immigrants from Nepal
$59,151
HOUSEHOLDER INCOME OVER 65 YEARS
13.0/ 100
METRIC RATING
206th/ 347
METRIC RANK
$61,843
HOUSEHOLDER INCOME OVER 65 YEARS
71.4/ 100
METRIC RATING
147th/ 347
METRIC RANK
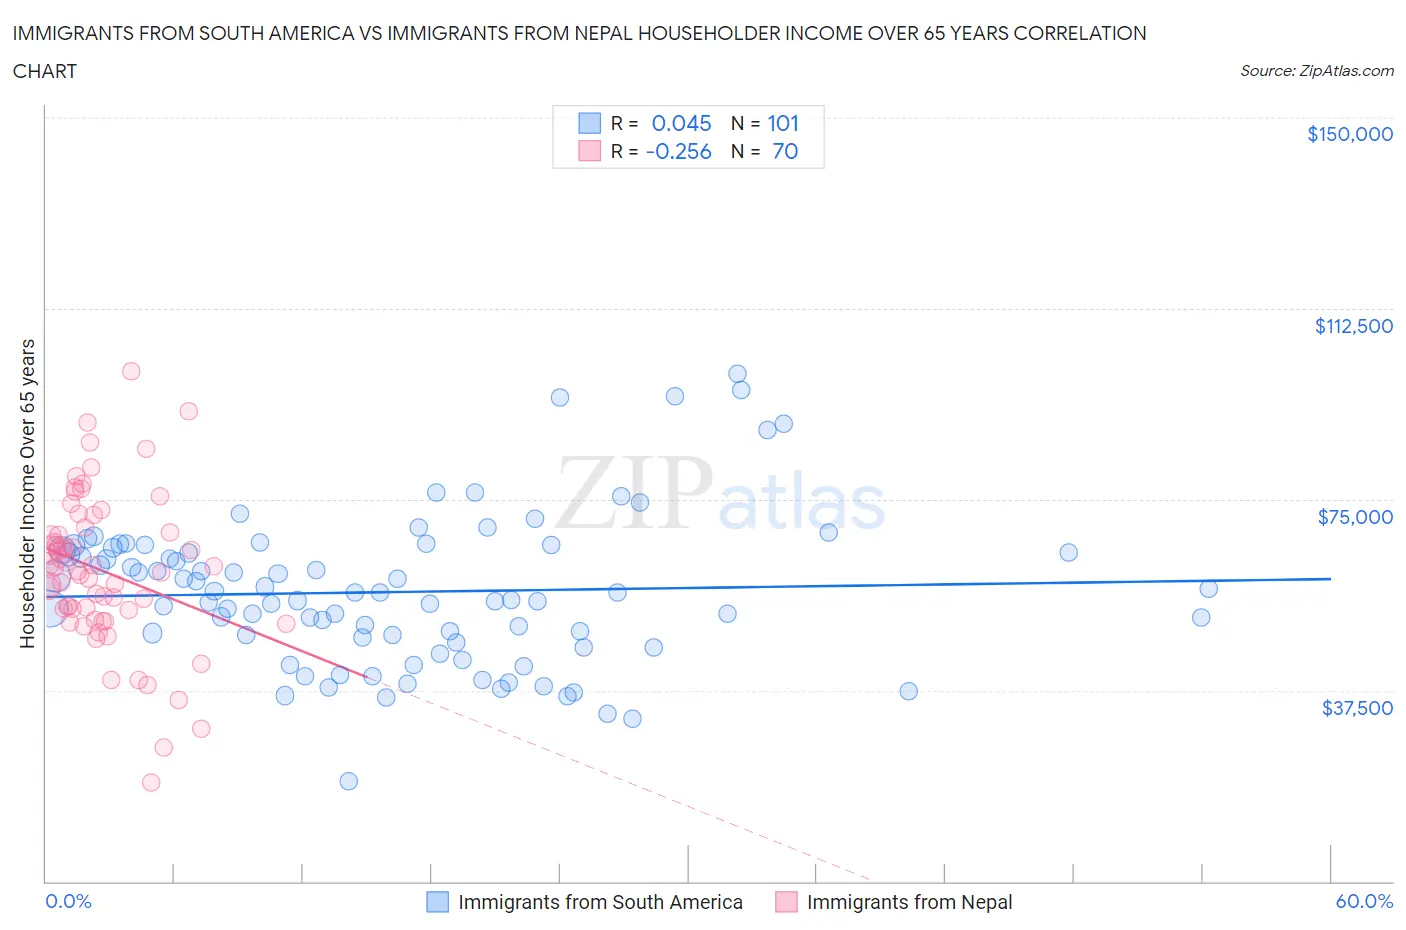
Immigrants from South America vs Immigrants from Nepal Householder Income Over 65 years Correlation Chart
The statistical analysis conducted on geographies consisting of 483,931,115 people shows no correlation between the proportion of Immigrants from South America and household income with householder over the age of 65 in the United States with a correlation coefficient (R) of 0.045 and weighted average of $59,151. Similarly, the statistical analysis conducted on geographies consisting of 186,386,270 people shows a weak negative correlation between the proportion of Immigrants from Nepal and household income with householder over the age of 65 in the United States with a correlation coefficient (R) of -0.256 and weighted average of $61,843, a difference of 4.5%.
Householder Income Over 65 years Correlation Summary
| Measurement | Immigrants from South America | Immigrants from Nepal |
| Minimum | $19,690 | $19,444 |
| Maximum | $99,659 | $100,278 |
| Range | $79,969 | $80,834 |
| Mean | $56,812 | $60,987 |
| Median | $56,602 | $61,190 |
| Interquartile 25% (IQ1) | $47,443 | $53,317 |
| Interquartile 75% (IQ3) | $65,274 | $68,526 |
| Interquartile Range (IQR) | $17,831 | $15,209 |
| Standard Deviation (Sample) | $14,727 | $14,956 |
| Standard Deviation (Population) | $14,654 | $14,849 |
Similar Demographics by Householder Income Over 65 years
Demographics Similar to Immigrants from South America by Householder Income Over 65 years
In terms of householder income over 65 years, the demographic groups most similar to Immigrants from South America are Salvadoran ($59,141, a difference of 0.020%), Uruguayan ($59,090, a difference of 0.10%), Immigrants from Sudan ($59,248, a difference of 0.16%), Slovak ($59,039, a difference of 0.19%), and Nigerian ($58,992, a difference of 0.27%).
| Demographics | Rating | Rank | Householder Income Over 65 years |
| Immigrants | Immigrants | 20.2 /100 | #199 | Fair $59,656 |
| French | 20.2 /100 | #200 | Fair $59,656 |
| Dutch | 18.3 /100 | #201 | Poor $59,539 |
| Finns | 18.2 /100 | #202 | Poor $59,535 |
| Scotch-Irish | 16.9 /100 | #203 | Poor $59,447 |
| Arapaho | 16.0 /100 | #204 | Poor $59,383 |
| Immigrants | Sudan | 14.2 /100 | #205 | Poor $59,248 |
| Immigrants | South America | 13.0 /100 | #206 | Poor $59,151 |
| Salvadorans | 12.9 /100 | #207 | Poor $59,141 |
| Uruguayans | 12.3 /100 | #208 | Poor $59,090 |
| Slovaks | 11.7 /100 | #209 | Poor $59,039 |
| Nigerians | 11.2 /100 | #210 | Poor $58,992 |
| Immigrants | Nigeria | 10.7 /100 | #211 | Poor $58,942 |
| Colombians | 9.8 /100 | #212 | Tragic $58,851 |
| Whites/Caucasians | 9.8 /100 | #213 | Tragic $58,847 |
Demographics Similar to Immigrants from Nepal by Householder Income Over 65 years
In terms of householder income over 65 years, the demographic groups most similar to Immigrants from Nepal are Alsatian ($61,797, a difference of 0.070%), Immigrants from Southern Europe ($61,902, a difference of 0.10%), Scottish ($61,735, a difference of 0.17%), Immigrants from Uganda ($61,976, a difference of 0.22%), and Slavic ($61,709, a difference of 0.22%).
| Demographics | Rating | Rank | Householder Income Over 65 years |
| Arabs | 79.6 /100 | #140 | Good $62,266 |
| Canadians | 79.0 /100 | #141 | Good $62,230 |
| South American Indians | 78.7 /100 | #142 | Good $62,215 |
| Immigrants | Belarus | 77.8 /100 | #143 | Good $62,162 |
| Immigrants | Peru | 74.4 /100 | #144 | Good $61,988 |
| Immigrants | Uganda | 74.2 /100 | #145 | Good $61,976 |
| Immigrants | Southern Europe | 72.7 /100 | #146 | Good $61,902 |
| Immigrants | Nepal | 71.4 /100 | #147 | Good $61,843 |
| Alsatians | 70.5 /100 | #148 | Good $61,797 |
| Scottish | 69.1 /100 | #149 | Good $61,735 |
| Slavs | 68.5 /100 | #150 | Good $61,709 |
| Hungarians | 67.7 /100 | #151 | Good $61,673 |
| Armenians | 67.3 /100 | #152 | Good $61,656 |
| Costa Ricans | 66.9 /100 | #153 | Good $61,638 |
| Swiss | 66.5 /100 | #154 | Good $61,621 |