Immigrants from South America vs Comanche Householder Income Over 65 years
COMPARE
Immigrants from South America
Comanche
Householder Income Over 65 years
Householder Income Over 65 years Comparison
Immigrants from South America
Comanche
$59,151
HOUSEHOLDER INCOME OVER 65 YEARS
13.0/ 100
METRIC RATING
206th/ 347
METRIC RANK
$54,922
HOUSEHOLDER INCOME OVER 65 YEARS
0.2/ 100
METRIC RATING
261st/ 347
METRIC RANK
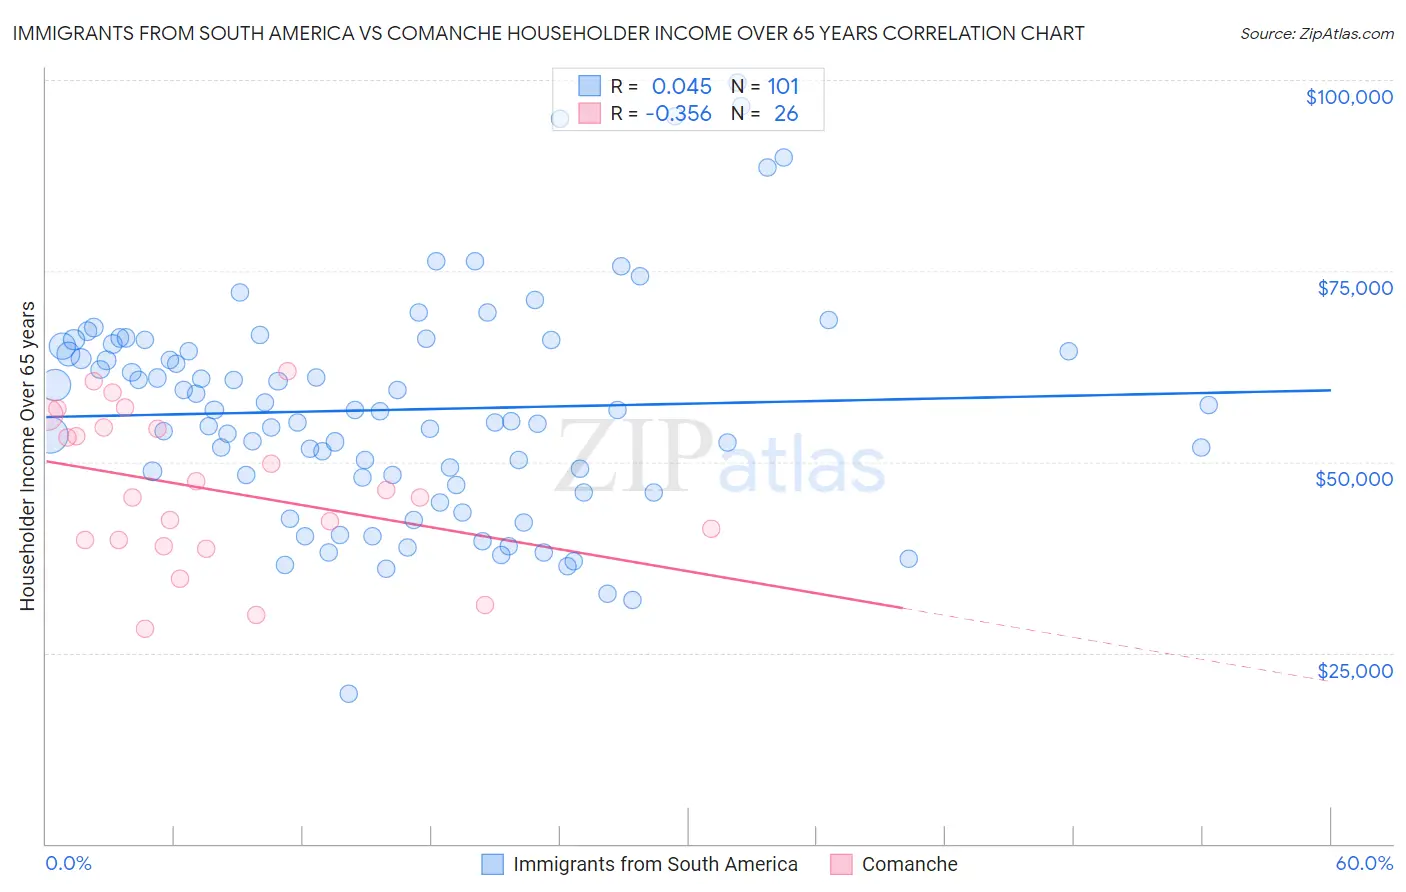
Immigrants from South America vs Comanche Householder Income Over 65 years Correlation Chart
The statistical analysis conducted on geographies consisting of 483,931,115 people shows no correlation between the proportion of Immigrants from South America and household income with householder over the age of 65 in the United States with a correlation coefficient (R) of 0.045 and weighted average of $59,151. Similarly, the statistical analysis conducted on geographies consisting of 109,617,596 people shows a mild negative correlation between the proportion of Comanche and household income with householder over the age of 65 in the United States with a correlation coefficient (R) of -0.356 and weighted average of $54,922, a difference of 7.7%.
Householder Income Over 65 years Correlation Summary
| Measurement | Immigrants from South America | Comanche |
| Minimum | $19,690 | $28,127 |
| Maximum | $99,659 | $61,875 |
| Range | $79,969 | $33,748 |
| Mean | $56,812 | $46,472 |
| Median | $56,602 | $45,782 |
| Interquartile 25% (IQ1) | $47,443 | $39,810 |
| Interquartile 75% (IQ3) | $65,274 | $54,432 |
| Interquartile Range (IQR) | $17,831 | $14,621 |
| Standard Deviation (Sample) | $14,727 | $9,777 |
| Standard Deviation (Population) | $14,654 | $9,587 |
Similar Demographics by Householder Income Over 65 years
Demographics Similar to Immigrants from South America by Householder Income Over 65 years
In terms of householder income over 65 years, the demographic groups most similar to Immigrants from South America are Salvadoran ($59,141, a difference of 0.020%), Uruguayan ($59,090, a difference of 0.10%), Immigrants from Sudan ($59,248, a difference of 0.16%), Slovak ($59,039, a difference of 0.19%), and Nigerian ($58,992, a difference of 0.27%).
| Demographics | Rating | Rank | Householder Income Over 65 years |
| Immigrants | Immigrants | 20.2 /100 | #199 | Fair $59,656 |
| French | 20.2 /100 | #200 | Fair $59,656 |
| Dutch | 18.3 /100 | #201 | Poor $59,539 |
| Finns | 18.2 /100 | #202 | Poor $59,535 |
| Scotch-Irish | 16.9 /100 | #203 | Poor $59,447 |
| Arapaho | 16.0 /100 | #204 | Poor $59,383 |
| Immigrants | Sudan | 14.2 /100 | #205 | Poor $59,248 |
| Immigrants | South America | 13.0 /100 | #206 | Poor $59,151 |
| Salvadorans | 12.9 /100 | #207 | Poor $59,141 |
| Uruguayans | 12.3 /100 | #208 | Poor $59,090 |
| Slovaks | 11.7 /100 | #209 | Poor $59,039 |
| Nigerians | 11.2 /100 | #210 | Poor $58,992 |
| Immigrants | Nigeria | 10.7 /100 | #211 | Poor $58,942 |
| Colombians | 9.8 /100 | #212 | Tragic $58,851 |
| Whites/Caucasians | 9.8 /100 | #213 | Tragic $58,847 |
Demographics Similar to Comanche by Householder Income Over 65 years
In terms of householder income over 65 years, the demographic groups most similar to Comanche are Immigrants from West Indies ($54,927, a difference of 0.010%), West Indian ($54,936, a difference of 0.030%), Ecuadorian ($54,958, a difference of 0.070%), Bangladeshi ($54,719, a difference of 0.37%), and French American Indian ($54,699, a difference of 0.41%).
| Demographics | Rating | Rank | Householder Income Over 65 years |
| Americans | 0.3 /100 | #254 | Tragic $55,527 |
| Immigrants | Bangladesh | 0.3 /100 | #255 | Tragic $55,394 |
| German Russians | 0.3 /100 | #256 | Tragic $55,356 |
| Trinidadians and Tobagonians | 0.3 /100 | #257 | Tragic $55,327 |
| Ecuadorians | 0.2 /100 | #258 | Tragic $54,958 |
| West Indians | 0.2 /100 | #259 | Tragic $54,936 |
| Immigrants | West Indies | 0.2 /100 | #260 | Tragic $54,927 |
| Comanche | 0.2 /100 | #261 | Tragic $54,922 |
| Bangladeshis | 0.1 /100 | #262 | Tragic $54,719 |
| French American Indians | 0.1 /100 | #263 | Tragic $54,699 |
| Apache | 0.1 /100 | #264 | Tragic $54,668 |
| Belizeans | 0.1 /100 | #265 | Tragic $54,580 |
| Jamaicans | 0.1 /100 | #266 | Tragic $54,560 |
| Guatemalans | 0.1 /100 | #267 | Tragic $54,526 |
| Immigrants | Zaire | 0.1 /100 | #268 | Tragic $54,512 |