South American Indian vs Immigrants from Jordan Householder Income Over 65 years
COMPARE
South American Indian
Immigrants from Jordan
Householder Income Over 65 years
Householder Income Over 65 years Comparison
South American Indians
Immigrants from Jordan
$62,215
HOUSEHOLDER INCOME OVER 65 YEARS
78.7/ 100
METRIC RATING
142nd/ 347
METRIC RANK
$63,041
HOUSEHOLDER INCOME OVER 65 YEARS
89.8/ 100
METRIC RATING
119th/ 347
METRIC RANK
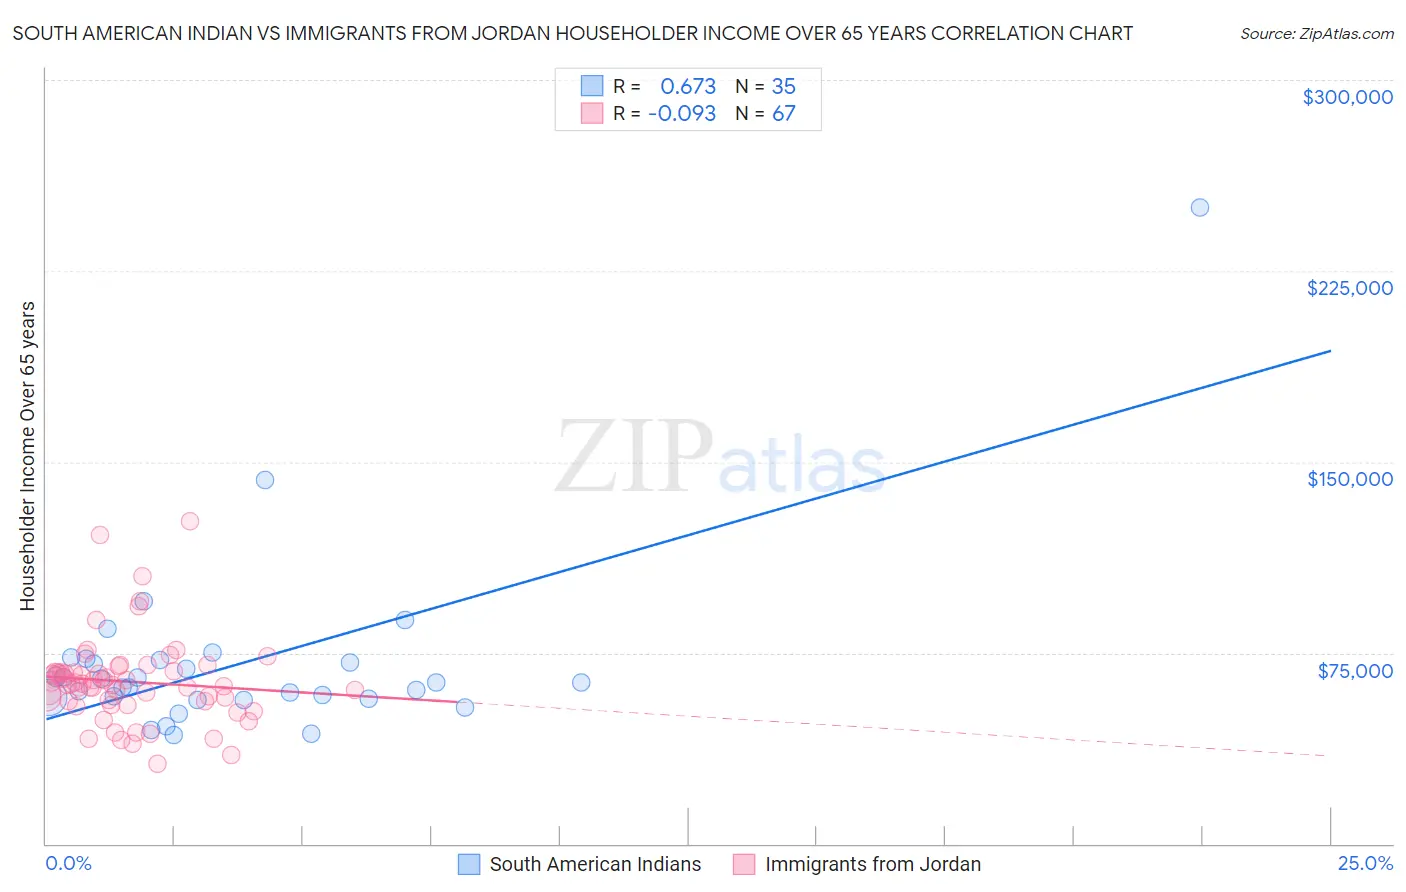
South American Indian vs Immigrants from Jordan Householder Income Over 65 years Correlation Chart
The statistical analysis conducted on geographies consisting of 164,391,818 people shows a significant positive correlation between the proportion of South American Indians and household income with householder over the age of 65 in the United States with a correlation coefficient (R) of 0.673 and weighted average of $62,215. Similarly, the statistical analysis conducted on geographies consisting of 181,136,935 people shows a slight negative correlation between the proportion of Immigrants from Jordan and household income with householder over the age of 65 in the United States with a correlation coefficient (R) of -0.093 and weighted average of $63,041, a difference of 1.3%.
Householder Income Over 65 years Correlation Summary
| Measurement | South American Indian | Immigrants from Jordan |
| Minimum | $42,500 | $31,244 |
| Maximum | $250,001 | $126,912 |
| Range | $207,501 | $95,668 |
| Mean | $70,859 | $63,669 |
| Median | $63,281 | $62,862 |
| Interquartile 25% (IQ1) | $56,818 | $55,944 |
| Interquartile 75% (IQ3) | $72,159 | $67,482 |
| Interquartile Range (IQR) | $15,341 | $11,537 |
| Standard Deviation (Sample) | $35,900 | $16,989 |
| Standard Deviation (Population) | $35,384 | $16,862 |
Similar Demographics by Householder Income Over 65 years
Demographics Similar to South American Indians by Householder Income Over 65 years
In terms of householder income over 65 years, the demographic groups most similar to South American Indians are Canadian ($62,230, a difference of 0.020%), Arab ($62,266, a difference of 0.080%), Immigrants from Belarus ($62,162, a difference of 0.090%), Immigrants from Kazakhstan ($62,292, a difference of 0.12%), and Lebanese ($62,287, a difference of 0.12%).
| Demographics | Rating | Rank | Householder Income Over 65 years |
| Immigrants | Chile | 81.0 /100 | #135 | Excellent $62,354 |
| Alaskan Athabascans | 80.6 /100 | #136 | Excellent $62,330 |
| Immigrants | Syria | 80.2 /100 | #137 | Excellent $62,303 |
| Immigrants | Kazakhstan | 80.0 /100 | #138 | Excellent $62,292 |
| Lebanese | 79.9 /100 | #139 | Good $62,287 |
| Arabs | 79.6 /100 | #140 | Good $62,266 |
| Canadians | 79.0 /100 | #141 | Good $62,230 |
| South American Indians | 78.7 /100 | #142 | Good $62,215 |
| Immigrants | Belarus | 77.8 /100 | #143 | Good $62,162 |
| Immigrants | Peru | 74.4 /100 | #144 | Good $61,988 |
| Immigrants | Uganda | 74.2 /100 | #145 | Good $61,976 |
| Immigrants | Southern Europe | 72.7 /100 | #146 | Good $61,902 |
| Immigrants | Nepal | 71.4 /100 | #147 | Good $61,843 |
| Alsatians | 70.5 /100 | #148 | Good $61,797 |
| Scottish | 69.1 /100 | #149 | Good $61,735 |
Demographics Similar to Immigrants from Jordan by Householder Income Over 65 years
In terms of householder income over 65 years, the demographic groups most similar to Immigrants from Jordan are Ukrainian ($63,032, a difference of 0.010%), Immigrants from Vietnam ($63,014, a difference of 0.040%), Danish ($63,117, a difference of 0.12%), Immigrants from Moldova ($62,939, a difference of 0.16%), and Tlingit-Haida ($62,922, a difference of 0.19%).
| Demographics | Rating | Rank | Householder Income Over 65 years |
| Syrians | 93.4 /100 | #112 | Exceptional $63,494 |
| Immigrants | Serbia | 92.7 /100 | #113 | Exceptional $63,387 |
| Immigrants | Saudi Arabia | 92.4 /100 | #114 | Exceptional $63,355 |
| Croatians | 91.4 /100 | #115 | Exceptional $63,225 |
| Guamanians/Chamorros | 91.1 /100 | #116 | Exceptional $63,187 |
| Immigrants | Croatia | 90.9 /100 | #117 | Exceptional $63,168 |
| Danes | 90.5 /100 | #118 | Exceptional $63,117 |
| Immigrants | Jordan | 89.8 /100 | #119 | Excellent $63,041 |
| Ukrainians | 89.7 /100 | #120 | Excellent $63,032 |
| Immigrants | Vietnam | 89.5 /100 | #121 | Excellent $63,014 |
| Immigrants | Moldova | 88.7 /100 | #122 | Excellent $62,939 |
| Tlingit-Haida | 88.6 /100 | #123 | Excellent $62,922 |
| Taiwanese | 88.3 /100 | #124 | Excellent $62,894 |
| Soviet Union | 87.8 /100 | #125 | Excellent $62,848 |
| Peruvians | 86.8 /100 | #126 | Excellent $62,766 |