Immigrants from South Eastern Asia vs Immigrants from Jordan Householder Income Over 65 years
COMPARE
Immigrants from South Eastern Asia
Immigrants from Jordan
Householder Income Over 65 years
Householder Income Over 65 years Comparison
Immigrants from South Eastern Asia
Immigrants from Jordan
$64,089
HOUSEHOLDER INCOME OVER 65 YEARS
96.3/ 100
METRIC RATING
100th/ 347
METRIC RANK
$63,041
HOUSEHOLDER INCOME OVER 65 YEARS
89.8/ 100
METRIC RATING
119th/ 347
METRIC RANK
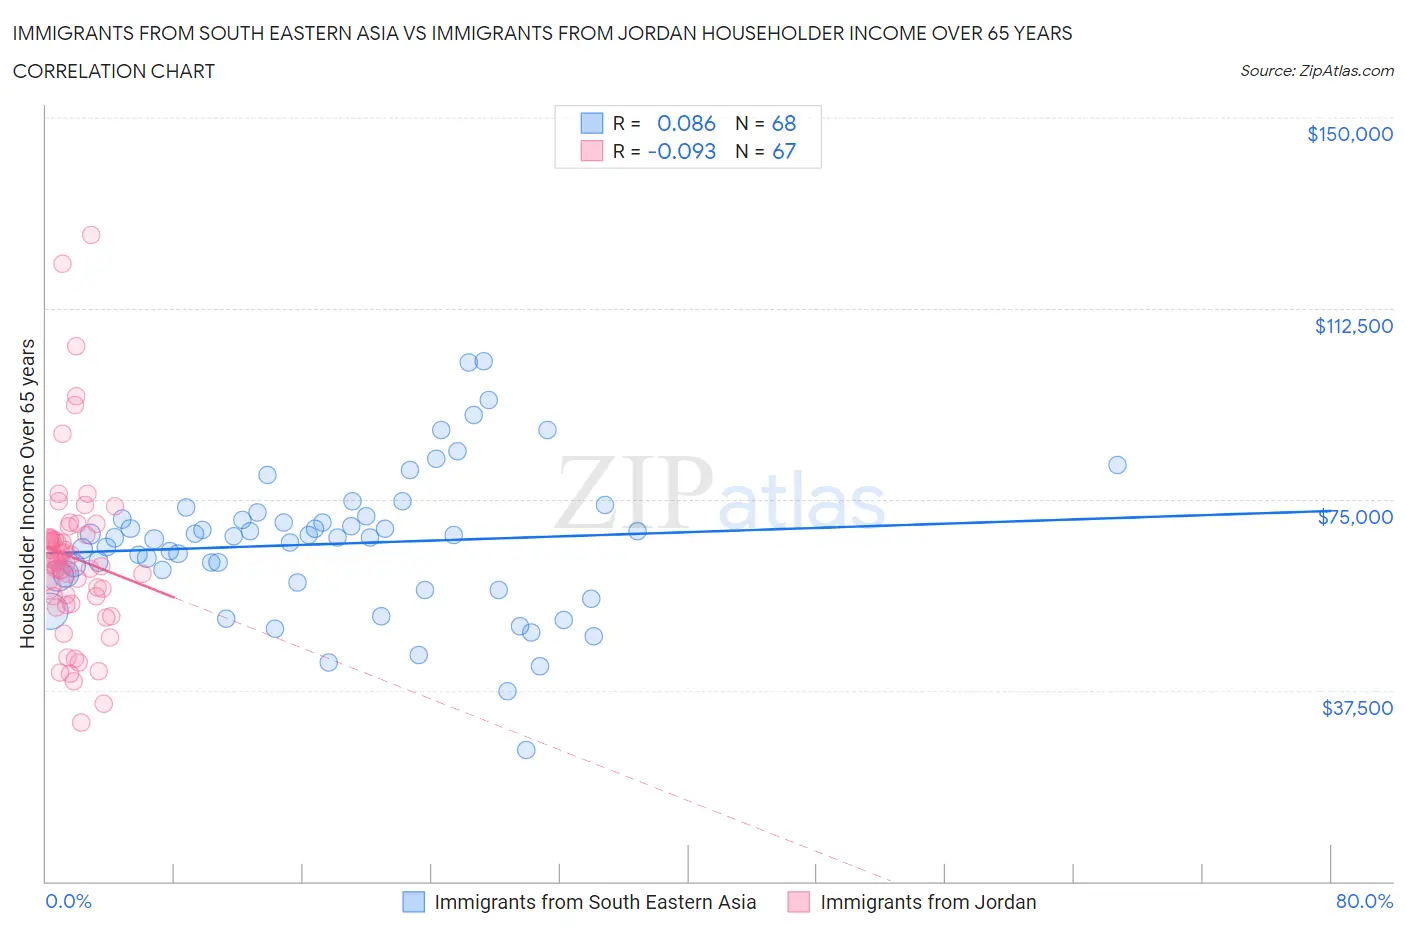
Immigrants from South Eastern Asia vs Immigrants from Jordan Householder Income Over 65 years Correlation Chart
The statistical analysis conducted on geographies consisting of 509,707,979 people shows a slight positive correlation between the proportion of Immigrants from South Eastern Asia and household income with householder over the age of 65 in the United States with a correlation coefficient (R) of 0.086 and weighted average of $64,089. Similarly, the statistical analysis conducted on geographies consisting of 181,136,935 people shows a slight negative correlation between the proportion of Immigrants from Jordan and household income with householder over the age of 65 in the United States with a correlation coefficient (R) of -0.093 and weighted average of $63,041, a difference of 1.7%.
Householder Income Over 65 years Correlation Summary
| Measurement | Immigrants from South Eastern Asia | Immigrants from Jordan |
| Minimum | $25,692 | $31,244 |
| Maximum | $102,052 | $126,912 |
| Range | $76,360 | $95,668 |
| Mean | $66,259 | $63,669 |
| Median | $67,494 | $62,862 |
| Interquartile 25% (IQ1) | $59,292 | $55,944 |
| Interquartile 75% (IQ3) | $71,386 | $67,482 |
| Interquartile Range (IQR) | $12,094 | $11,537 |
| Standard Deviation (Sample) | $14,078 | $16,989 |
| Standard Deviation (Population) | $13,974 | $16,862 |
Demographics Similar to Immigrants from South Eastern Asia and Immigrants from Jordan by Householder Income Over 65 years
In terms of householder income over 65 years, the demographic groups most similar to Immigrants from South Eastern Asia are Assyrian/Chaldean/Syriac ($64,108, a difference of 0.030%), Immigrants from Italy ($64,065, a difference of 0.040%), Chilean ($63,957, a difference of 0.21%), British ($63,940, a difference of 0.23%), and Immigrants from Cameroon ($63,907, a difference of 0.28%). Similarly, the demographic groups most similar to Immigrants from Jordan are Danish ($63,117, a difference of 0.12%), Immigrants from Croatia ($63,168, a difference of 0.20%), Guamanian/Chamorro ($63,187, a difference of 0.23%), Croatian ($63,225, a difference of 0.29%), and Immigrants from Saudi Arabia ($63,355, a difference of 0.50%).
| Demographics | Rating | Rank | Householder Income Over 65 years |
| Assyrians/Chaldeans/Syriacs | 96.4 /100 | #99 | Exceptional $64,108 |
| Immigrants | South Eastern Asia | 96.3 /100 | #100 | Exceptional $64,089 |
| Immigrants | Italy | 96.2 /100 | #101 | Exceptional $64,065 |
| Chileans | 95.8 /100 | #102 | Exceptional $63,957 |
| British | 95.7 /100 | #103 | Exceptional $63,940 |
| Immigrants | Cameroon | 95.6 /100 | #104 | Exceptional $63,907 |
| Italians | 95.5 /100 | #105 | Exceptional $63,885 |
| Immigrants | Argentina | 95.5 /100 | #106 | Exceptional $63,885 |
| Pakistanis | 95.3 /100 | #107 | Exceptional $63,844 |
| Palestinians | 95.1 /100 | #108 | Exceptional $63,800 |
| Europeans | 95.0 /100 | #109 | Exceptional $63,779 |
| Immigrants | Zimbabwe | 94.3 /100 | #110 | Exceptional $63,643 |
| Immigrants | Spain | 93.7 /100 | #111 | Exceptional $63,540 |
| Syrians | 93.4 /100 | #112 | Exceptional $63,494 |
| Immigrants | Serbia | 92.7 /100 | #113 | Exceptional $63,387 |
| Immigrants | Saudi Arabia | 92.4 /100 | #114 | Exceptional $63,355 |
| Croatians | 91.4 /100 | #115 | Exceptional $63,225 |
| Guamanians/Chamorros | 91.1 /100 | #116 | Exceptional $63,187 |
| Immigrants | Croatia | 90.9 /100 | #117 | Exceptional $63,168 |
| Danes | 90.5 /100 | #118 | Exceptional $63,117 |
| Immigrants | Jordan | 89.8 /100 | #119 | Excellent $63,041 |