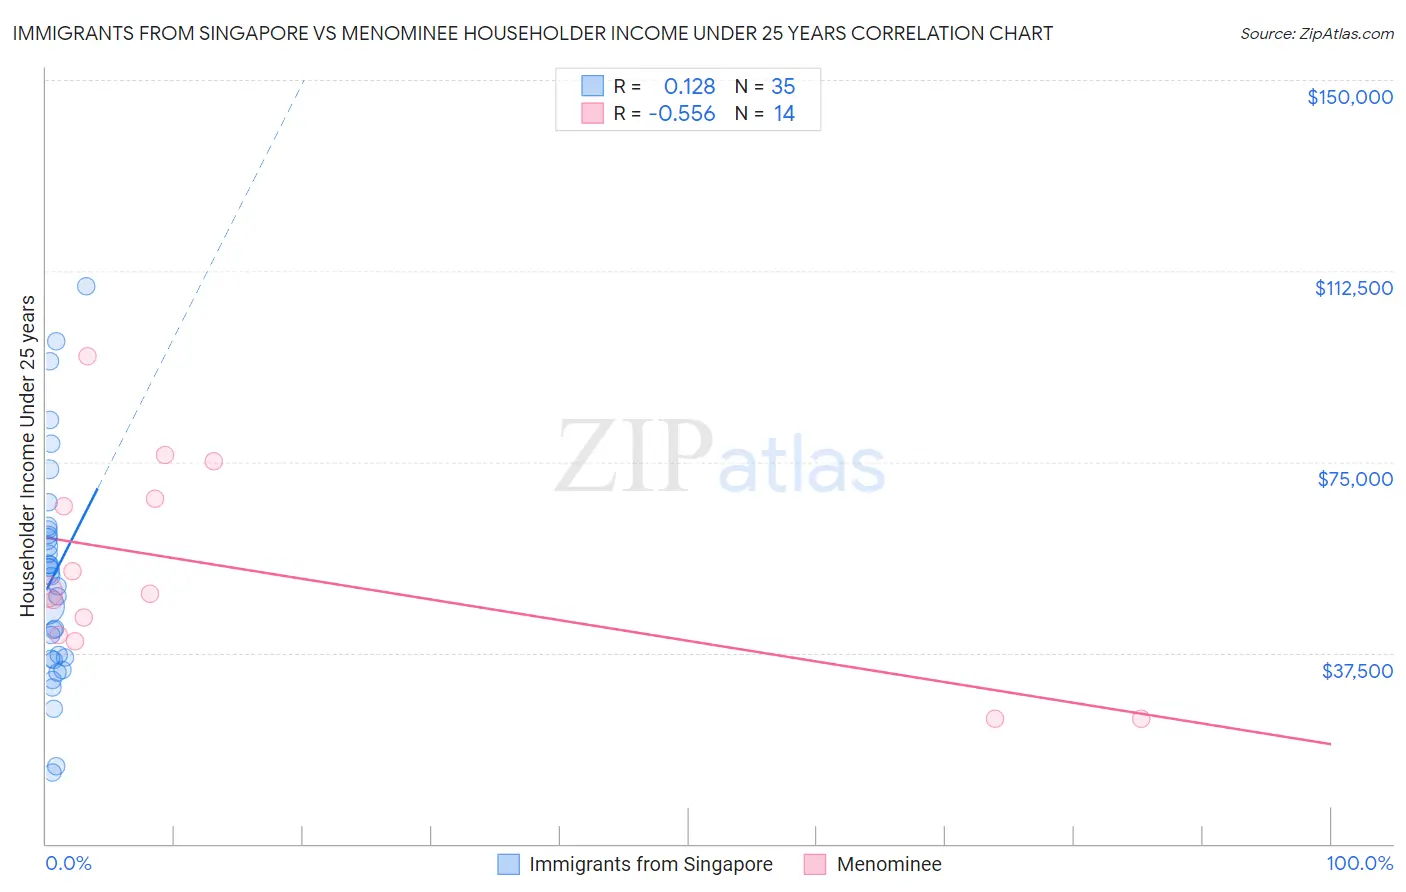
Immigrants from Singapore vs Menominee Householder Income Under 25 years
COMPARE
Immigrants from Singapore
Menominee
Householder Income Under 25 years
Householder Income Under 25 years Comparison
Immigrants from Singapore
Menominee
$56,835
HOUSEHOLDER INCOME UNDER 25 YEARS
100.0/ 100
METRIC RATING
24th/ 347
METRIC RANK
$47,907
HOUSEHOLDER INCOME UNDER 25 YEARS
0.0/ 100
METRIC RATING
304th/ 347
METRIC RANK
Immigrants from Singapore vs Menominee Householder Income Under 25 years Correlation Chart
The statistical analysis conducted on geographies consisting of 123,473,430 people shows a poor positive correlation between the proportion of Immigrants from Singapore and household income with householder under the age of 25 in the United States with a correlation coefficient (R) of 0.128 and weighted average of $56,835. Similarly, the statistical analysis conducted on geographies consisting of 44,234,460 people shows a substantial negative correlation between the proportion of Menominee and household income with householder under the age of 25 in the United States with a correlation coefficient (R) of -0.556 and weighted average of $47,907, a difference of 18.6%.
Householder Income Under 25 years Correlation Summary
| Measurement | Immigrants from Singapore | Menominee |
| Minimum | $14,087 | $24,615 |
| Maximum | $109,471 | $95,833 |
| Range | $95,384 | $71,218 |
| Mean | $52,518 | $53,984 |
| Median | $52,500 | $49,327 |
| Interquartile 25% (IQ1) | $36,250 | $41,044 |
| Interquartile 75% (IQ3) | $61,737 | $67,708 |
| Interquartile Range (IQR) | $25,487 | $26,664 |
| Standard Deviation (Sample) | $21,943 | $20,193 |
| Standard Deviation (Population) | $21,627 | $19,458 |
Similar Demographics by Householder Income Under 25 years
Demographics Similar to Immigrants from Singapore by Householder Income Under 25 years
In terms of householder income under 25 years, the demographic groups most similar to Immigrants from Singapore are Immigrants from Pakistan ($56,789, a difference of 0.080%), Tongan ($56,972, a difference of 0.24%), Asian ($57,003, a difference of 0.29%), Immigrants from Australia ($56,660, a difference of 0.31%), and Immigrants from Ireland ($57,075, a difference of 0.42%).
| Demographics | Rating | Rank | Householder Income Under 25 years |
| Sierra Leoneans | 100.0 /100 | #17 | Exceptional $57,272 |
| Immigrants | Eastern Asia | 100.0 /100 | #18 | Exceptional $57,123 |
| Bhutanese | 100.0 /100 | #19 | Exceptional $57,078 |
| Immigrants | Ireland | 100.0 /100 | #20 | Exceptional $57,075 |
| Immigrants | Fiji | 100.0 /100 | #21 | Exceptional $57,074 |
| Asians | 100.0 /100 | #22 | Exceptional $57,003 |
| Tongans | 100.0 /100 | #23 | Exceptional $56,972 |
| Immigrants | Singapore | 100.0 /100 | #24 | Exceptional $56,835 |
| Immigrants | Pakistan | 100.0 /100 | #25 | Exceptional $56,789 |
| Immigrants | Australia | 100.0 /100 | #26 | Exceptional $56,660 |
| Immigrants | North Macedonia | 100.0 /100 | #27 | Exceptional $56,503 |
| Immigrants | Peru | 100.0 /100 | #28 | Exceptional $56,384 |
| Immigrants | Asia | 100.0 /100 | #29 | Exceptional $56,379 |
| Immigrants | Moldova | 100.0 /100 | #30 | Exceptional $56,168 |
| Vietnamese | 100.0 /100 | #31 | Exceptional $56,127 |
Demographics Similar to Menominee by Householder Income Under 25 years
In terms of householder income under 25 years, the demographic groups most similar to Menominee are Immigrants from Middle Africa ($47,916, a difference of 0.020%), Cherokee ($47,848, a difference of 0.12%), Immigrants from Liberia ($47,981, a difference of 0.15%), Native/Alaskan ($47,704, a difference of 0.43%), and Immigrants from Kuwait ($48,126, a difference of 0.46%).
| Demographics | Rating | Rank | Householder Income Under 25 years |
| Cree | 0.0 /100 | #297 | Tragic $48,514 |
| Yaqui | 0.0 /100 | #298 | Tragic $48,300 |
| Immigrants | Honduras | 0.0 /100 | #299 | Tragic $48,267 |
| Immigrants | Somalia | 0.0 /100 | #300 | Tragic $48,135 |
| Immigrants | Kuwait | 0.0 /100 | #301 | Tragic $48,126 |
| Immigrants | Liberia | 0.0 /100 | #302 | Tragic $47,981 |
| Immigrants | Middle Africa | 0.0 /100 | #303 | Tragic $47,916 |
| Menominee | 0.0 /100 | #304 | Tragic $47,907 |
| Cherokee | 0.0 /100 | #305 | Tragic $47,848 |
| Natives/Alaskans | 0.0 /100 | #306 | Tragic $47,704 |
| Bangladeshis | 0.0 /100 | #307 | Tragic $47,589 |
| Comanche | 0.0 /100 | #308 | Tragic $47,518 |
| U.S. Virgin Islanders | 0.0 /100 | #309 | Tragic $47,448 |
| Iroquois | 0.0 /100 | #310 | Tragic $47,380 |
| Ottawa | 0.0 /100 | #311 | Tragic $47,366 |