Immigrants from Singapore vs Croatian 3rd Grade
COMPARE
Immigrants from Singapore
Croatian
3rd Grade
3rd Grade Comparison
Immigrants from Singapore
Croatians
98.0%
3RD GRADE
96.7/ 100
METRIC RATING
108th/ 347
METRIC RANK
98.5%
3RD GRADE
100.0/ 100
METRIC RATING
27th/ 347
METRIC RANK
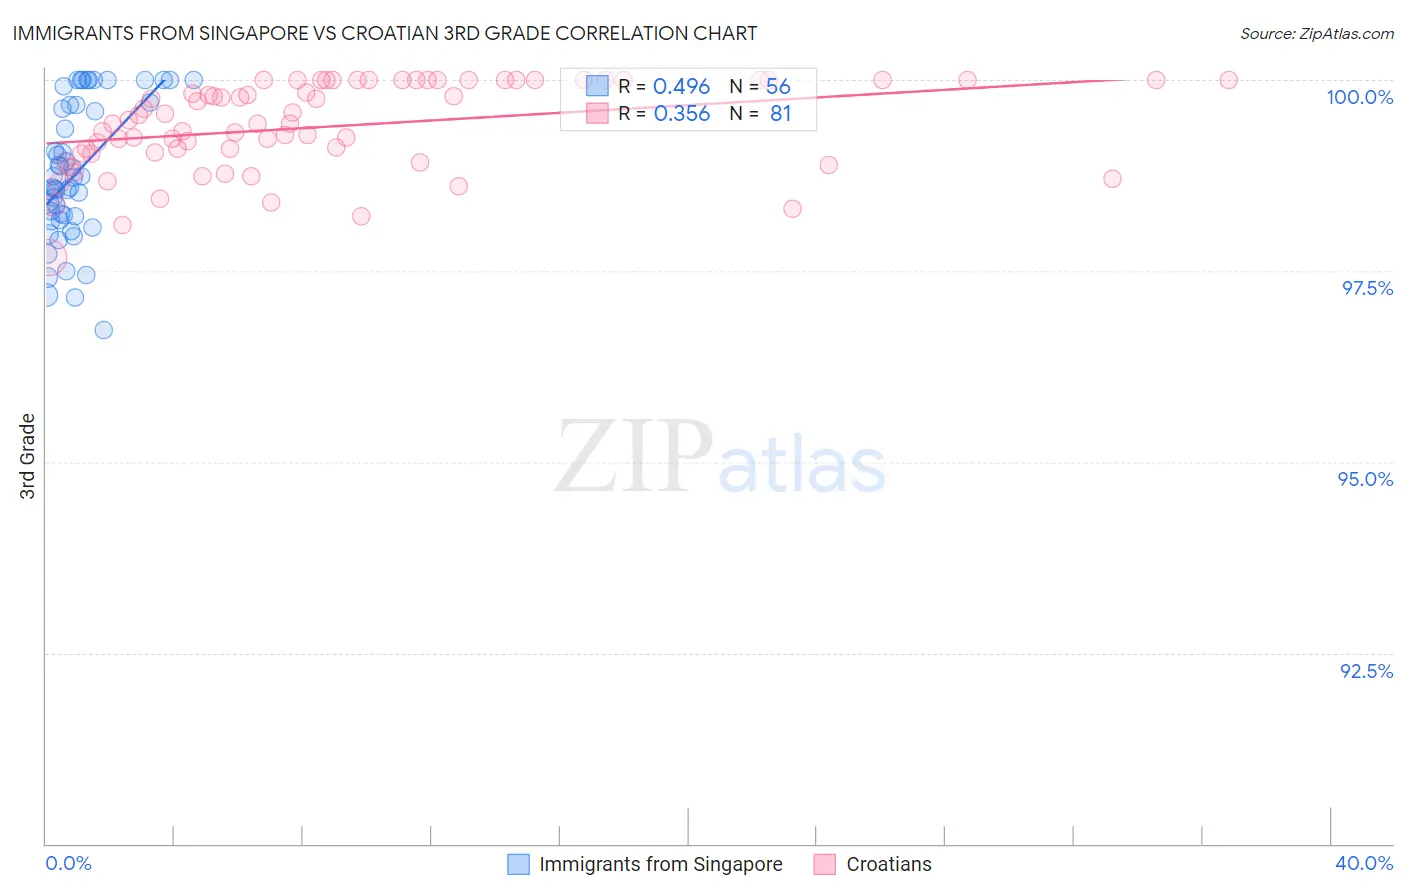
Immigrants from Singapore vs Croatian 3rd Grade Correlation Chart
The statistical analysis conducted on geographies consisting of 137,521,094 people shows a moderate positive correlation between the proportion of Immigrants from Singapore and percentage of population with at least 3rd grade education in the United States with a correlation coefficient (R) of 0.496 and weighted average of 98.0%. Similarly, the statistical analysis conducted on geographies consisting of 375,731,938 people shows a mild positive correlation between the proportion of Croatians and percentage of population with at least 3rd grade education in the United States with a correlation coefficient (R) of 0.356 and weighted average of 98.5%, a difference of 0.43%.
3rd Grade Correlation Summary
| Measurement | Immigrants from Singapore | Croatian |
| Minimum | 96.7% | 97.7% |
| Maximum | 100.0% | 100.0% |
| Range | 3.3% | 2.3% |
| Mean | 98.8% | 99.4% |
| Median | 98.7% | 99.4% |
| Interquartile 25% (IQ1) | 98.2% | 99.0% |
| Interquartile 75% (IQ3) | 99.7% | 100.0% |
| Interquartile Range (IQR) | 1.5% | 0.96% |
| Standard Deviation (Sample) | 0.89% | 0.58% |
| Standard Deviation (Population) | 0.88% | 0.57% |
Similar Demographics by 3rd Grade
Demographics Similar to Immigrants from Singapore by 3rd Grade
In terms of 3rd grade, the demographic groups most similar to Immigrants from Singapore are Pima (98.0%, a difference of 0.0%), Immigrants from Switzerland (98.0%, a difference of 0.0%), German Russian (98.1%, a difference of 0.010%), Bhutanese (98.1%, a difference of 0.010%), and Immigrants from Czechoslovakia (98.0%, a difference of 0.010%).
| Demographics | Rating | Rank | 3rd Grade |
| Puget Sound Salish | 97.9 /100 | #101 | Exceptional 98.1% |
| Immigrants | Nonimmigrants | 97.8 /100 | #102 | Exceptional 98.1% |
| Yugoslavians | 97.7 /100 | #103 | Exceptional 98.1% |
| Turks | 97.6 /100 | #104 | Exceptional 98.1% |
| German Russians | 97.2 /100 | #105 | Exceptional 98.1% |
| Bhutanese | 97.2 /100 | #106 | Exceptional 98.1% |
| Immigrants | Czechoslovakia | 97.0 /100 | #107 | Exceptional 98.0% |
| Immigrants | Singapore | 96.7 /100 | #108 | Exceptional 98.0% |
| Pima | 96.7 /100 | #109 | Exceptional 98.0% |
| Immigrants | Switzerland | 96.6 /100 | #110 | Exceptional 98.0% |
| Basques | 96.5 /100 | #111 | Exceptional 98.0% |
| Immigrants | Latvia | 96.0 /100 | #112 | Exceptional 98.0% |
| Thais | 95.5 /100 | #113 | Exceptional 98.0% |
| Menominee | 95.4 /100 | #114 | Exceptional 98.0% |
| Okinawans | 95.2 /100 | #115 | Exceptional 98.0% |
Demographics Similar to Croatians by 3rd Grade
In terms of 3rd grade, the demographic groups most similar to Croatians are Scotch-Irish (98.5%, a difference of 0.010%), Aleut (98.5%, a difference of 0.010%), French (98.4%, a difference of 0.010%), Finnish (98.5%, a difference of 0.020%), and Sioux (98.5%, a difference of 0.020%).
| Demographics | Rating | Rank | 3rd Grade |
| Pennsylvania Germans | 100.0 /100 | #20 | Exceptional 98.5% |
| Lithuanians | 100.0 /100 | #21 | Exceptional 98.5% |
| Finns | 100.0 /100 | #22 | Exceptional 98.5% |
| Sioux | 100.0 /100 | #23 | Exceptional 98.5% |
| Danes | 100.0 /100 | #24 | Exceptional 98.5% |
| Scotch-Irish | 100.0 /100 | #25 | Exceptional 98.5% |
| Aleuts | 100.0 /100 | #26 | Exceptional 98.5% |
| Croatians | 100.0 /100 | #27 | Exceptional 98.5% |
| French | 100.0 /100 | #28 | Exceptional 98.4% |
| French Canadians | 100.0 /100 | #29 | Exceptional 98.4% |
| Europeans | 100.0 /100 | #30 | Exceptional 98.4% |
| Czechs | 100.0 /100 | #31 | Exceptional 98.4% |
| Scandinavians | 100.0 /100 | #32 | Exceptional 98.4% |
| Chinese | 100.0 /100 | #33 | Exceptional 98.4% |
| Swiss | 100.0 /100 | #34 | Exceptional 98.4% |