Immigrants from Australia vs Spanish American Indian Householder Income Ages 45 - 64 years
COMPARE
Immigrants from Australia
Spanish American Indian
Householder Income Ages 45 - 64 years
Householder Income Ages 45 - 64 years Comparison
Immigrants from Australia
Spanish American Indians
$119,308
HOUSEHOLDER INCOME AGES 45 - 64 YEARS
100.0/ 100
METRIC RATING
20th/ 347
METRIC RANK
$87,561
HOUSEHOLDER INCOME AGES 45 - 64 YEARS
0.2/ 100
METRIC RATING
273rd/ 347
METRIC RANK
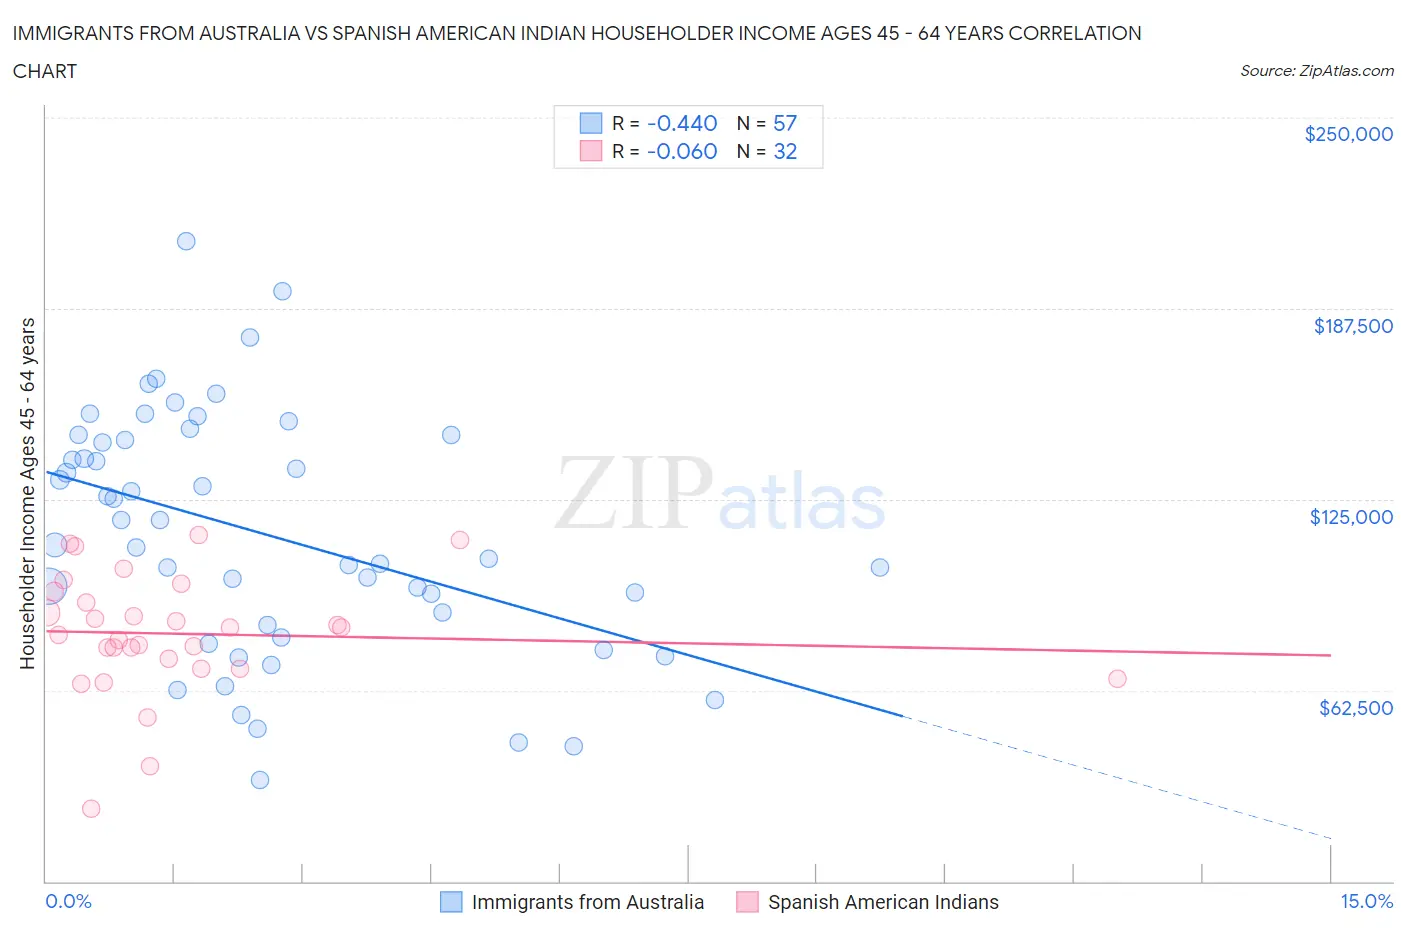
Immigrants from Australia vs Spanish American Indian Householder Income Ages 45 - 64 years Correlation Chart
The statistical analysis conducted on geographies consisting of 227,010,671 people shows a moderate negative correlation between the proportion of Immigrants from Australia and household income with householder between the ages 45 and 64 in the United States with a correlation coefficient (R) of -0.440 and weighted average of $119,308. Similarly, the statistical analysis conducted on geographies consisting of 73,124,426 people shows a slight negative correlation between the proportion of Spanish American Indians and household income with householder between the ages 45 and 64 in the United States with a correlation coefficient (R) of -0.060 and weighted average of $87,561, a difference of 36.3%.
Householder Income Ages 45 - 64 years Correlation Summary
| Measurement | Immigrants from Australia | Spanish American Indian |
| Minimum | $33,125 | $23,558 |
| Maximum | $209,440 | $113,198 |
| Range | $176,315 | $89,640 |
| Mean | $113,549 | $80,973 |
| Median | $110,175 | $81,710 |
| Interquartile 25% (IQ1) | $81,830 | $71,336 |
| Interquartile 75% (IQ3) | $145,190 | $93,059 |
| Interquartile Range (IQR) | $63,360 | $21,723 |
| Standard Deviation (Sample) | $39,602 | $19,833 |
| Standard Deviation (Population) | $39,253 | $19,521 |
Similar Demographics by Householder Income Ages 45 - 64 years
Demographics Similar to Immigrants from Australia by Householder Income Ages 45 - 64 years
In terms of householder income ages 45 - 64 years, the demographic groups most similar to Immigrants from Australia are Immigrants from Sri Lanka ($119,094, a difference of 0.18%), Immigrants from Belgium ($118,932, a difference of 0.32%), Bolivian ($118,871, a difference of 0.37%), Immigrants from Japan ($118,498, a difference of 0.68%), and Asian ($118,426, a difference of 0.74%).
| Demographics | Rating | Rank | Householder Income Ages 45 - 64 years |
| Immigrants | Ireland | 100.0 /100 | #13 | Exceptional $122,757 |
| Indians (Asian) | 100.0 /100 | #14 | Exceptional $122,343 |
| Immigrants | Eastern Asia | 100.0 /100 | #15 | Exceptional $122,222 |
| Immigrants | China | 100.0 /100 | #16 | Exceptional $122,178 |
| Burmese | 100.0 /100 | #17 | Exceptional $121,444 |
| Immigrants | Korea | 100.0 /100 | #18 | Exceptional $121,243 |
| Eastern Europeans | 100.0 /100 | #19 | Exceptional $120,684 |
| Immigrants | Australia | 100.0 /100 | #20 | Exceptional $119,308 |
| Immigrants | Sri Lanka | 100.0 /100 | #21 | Exceptional $119,094 |
| Immigrants | Belgium | 100.0 /100 | #22 | Exceptional $118,932 |
| Bolivians | 100.0 /100 | #23 | Exceptional $118,871 |
| Immigrants | Japan | 100.0 /100 | #24 | Exceptional $118,498 |
| Asians | 100.0 /100 | #25 | Exceptional $118,426 |
| Immigrants | Sweden | 100.0 /100 | #26 | Exceptional $118,318 |
| Immigrants | Northern Europe | 100.0 /100 | #27 | Exceptional $117,930 |
Demographics Similar to Spanish American Indians by Householder Income Ages 45 - 64 years
In terms of householder income ages 45 - 64 years, the demographic groups most similar to Spanish American Indians are Cape Verdean ($87,580, a difference of 0.020%), Guatemalan ($87,705, a difference of 0.16%), Immigrants from Liberia ($87,739, a difference of 0.20%), Spanish American ($87,836, a difference of 0.31%), and Immigrants from Micronesia ($87,864, a difference of 0.35%).
| Demographics | Rating | Rank | Householder Income Ages 45 - 64 years |
| Immigrants | West Indies | 0.2 /100 | #266 | Tragic $88,164 |
| Hmong | 0.2 /100 | #267 | Tragic $88,115 |
| Immigrants | Micronesia | 0.2 /100 | #268 | Tragic $87,864 |
| Spanish Americans | 0.2 /100 | #269 | Tragic $87,836 |
| Immigrants | Liberia | 0.2 /100 | #270 | Tragic $87,739 |
| Guatemalans | 0.2 /100 | #271 | Tragic $87,705 |
| Cape Verdeans | 0.2 /100 | #272 | Tragic $87,580 |
| Spanish American Indians | 0.2 /100 | #273 | Tragic $87,561 |
| Iroquois | 0.1 /100 | #274 | Tragic $87,255 |
| Immigrants | Belize | 0.1 /100 | #275 | Tragic $87,229 |
| Immigrants | Latin America | 0.1 /100 | #276 | Tragic $87,219 |
| Cree | 0.1 /100 | #277 | Tragic $87,185 |
| Immigrants | Jamaica | 0.1 /100 | #278 | Tragic $87,035 |
| Yakama | 0.1 /100 | #279 | Tragic $86,992 |
| Immigrants | Somalia | 0.1 /100 | #280 | Tragic $86,987 |