Immigrants from India vs Spanish American Indian Householder Income Ages 45 - 64 years
COMPARE
Immigrants from India
Spanish American Indian
Householder Income Ages 45 - 64 years
Householder Income Ages 45 - 64 years Comparison
Immigrants from India
Spanish American Indians
$132,488
HOUSEHOLDER INCOME AGES 45 - 64 YEARS
100.0/ 100
METRIC RATING
3rd/ 347
METRIC RANK
$87,561
HOUSEHOLDER INCOME AGES 45 - 64 YEARS
0.2/ 100
METRIC RATING
273rd/ 347
METRIC RANK
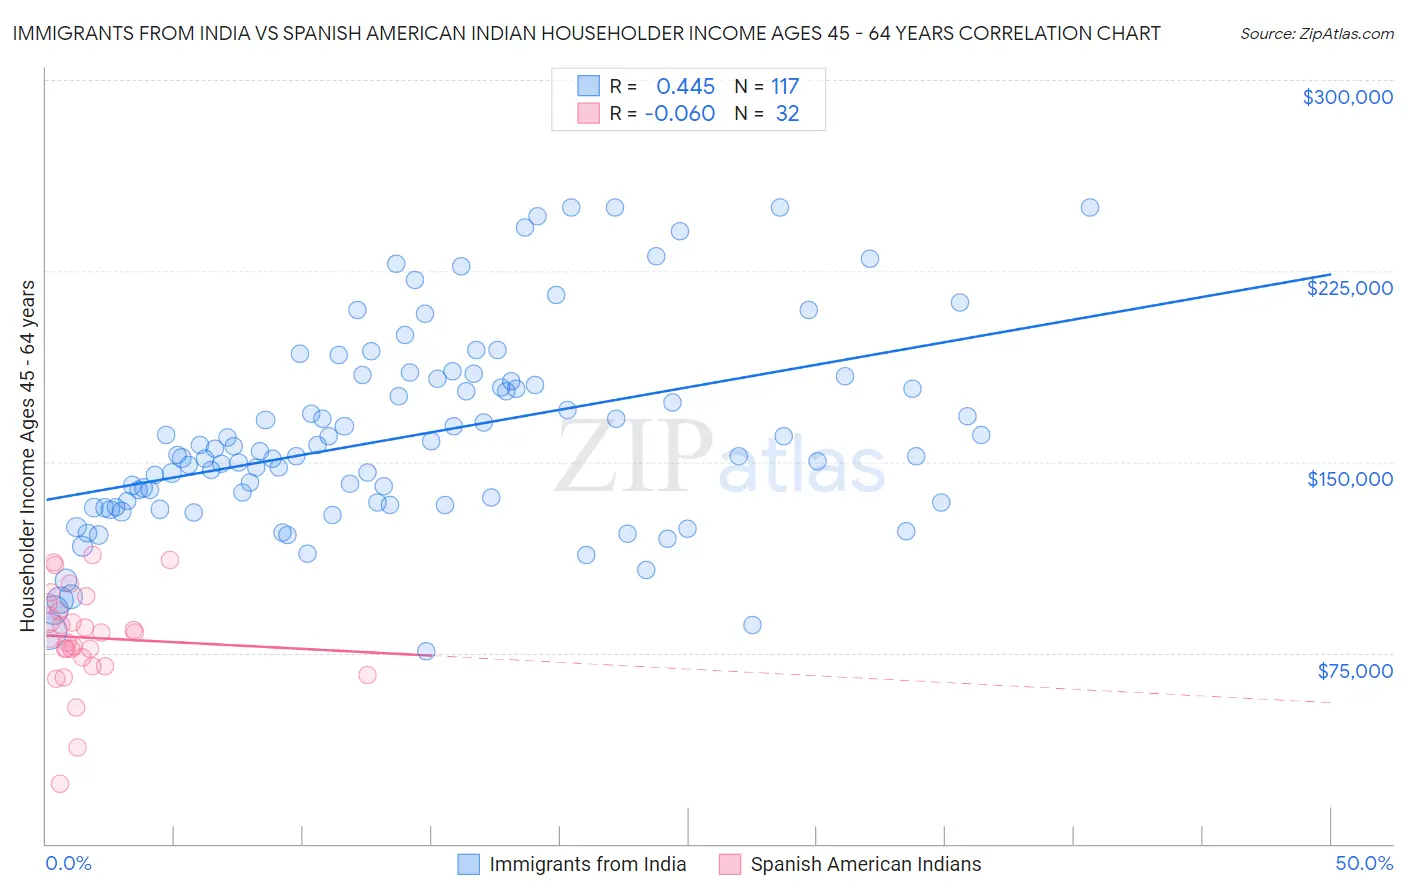
Immigrants from India vs Spanish American Indian Householder Income Ages 45 - 64 years Correlation Chart
The statistical analysis conducted on geographies consisting of 433,193,129 people shows a moderate positive correlation between the proportion of Immigrants from India and household income with householder between the ages 45 and 64 in the United States with a correlation coefficient (R) of 0.445 and weighted average of $132,488. Similarly, the statistical analysis conducted on geographies consisting of 73,124,426 people shows a slight negative correlation between the proportion of Spanish American Indians and household income with householder between the ages 45 and 64 in the United States with a correlation coefficient (R) of -0.060 and weighted average of $87,561, a difference of 51.3%.
Householder Income Ages 45 - 64 years Correlation Summary
| Measurement | Immigrants from India | Spanish American Indian |
| Minimum | $75,405 | $23,558 |
| Maximum | $250,001 | $113,198 |
| Range | $174,596 | $89,640 |
| Mean | $160,116 | $80,973 |
| Median | $152,750 | $81,710 |
| Interquartile 25% (IQ1) | $133,078 | $71,336 |
| Interquartile 75% (IQ3) | $182,310 | $93,059 |
| Interquartile Range (IQR) | $49,232 | $21,723 |
| Standard Deviation (Sample) | $38,891 | $19,833 |
| Standard Deviation (Population) | $38,724 | $19,521 |
Similar Demographics by Householder Income Ages 45 - 64 years
Demographics Similar to Immigrants from India by Householder Income Ages 45 - 64 years
In terms of householder income ages 45 - 64 years, the demographic groups most similar to Immigrants from India are Filipino ($134,910, a difference of 1.8%), Thai ($129,560, a difference of 2.3%), Immigrants from Taiwan ($135,508, a difference of 2.3%), Immigrants from Singapore ($129,514, a difference of 2.3%), and Iranian ($129,350, a difference of 2.4%).
| Demographics | Rating | Rank | Householder Income Ages 45 - 64 years |
| Immigrants | Taiwan | 100.0 /100 | #1 | Exceptional $135,508 |
| Filipinos | 100.0 /100 | #2 | Exceptional $134,910 |
| Immigrants | India | 100.0 /100 | #3 | Exceptional $132,488 |
| Thais | 100.0 /100 | #4 | Exceptional $129,560 |
| Immigrants | Singapore | 100.0 /100 | #5 | Exceptional $129,514 |
| Iranians | 100.0 /100 | #6 | Exceptional $129,350 |
| Immigrants | Hong Kong | 100.0 /100 | #7 | Exceptional $127,500 |
| Immigrants | Iran | 100.0 /100 | #8 | Exceptional $126,940 |
| Okinawans | 100.0 /100 | #9 | Exceptional $124,796 |
| Immigrants | South Central Asia | 100.0 /100 | #10 | Exceptional $124,188 |
| Cypriots | 100.0 /100 | #11 | Exceptional $123,396 |
| Immigrants | Israel | 100.0 /100 | #12 | Exceptional $122,893 |
| Immigrants | Ireland | 100.0 /100 | #13 | Exceptional $122,757 |
| Indians (Asian) | 100.0 /100 | #14 | Exceptional $122,343 |
| Immigrants | Eastern Asia | 100.0 /100 | #15 | Exceptional $122,222 |
Demographics Similar to Spanish American Indians by Householder Income Ages 45 - 64 years
In terms of householder income ages 45 - 64 years, the demographic groups most similar to Spanish American Indians are Cape Verdean ($87,580, a difference of 0.020%), Guatemalan ($87,705, a difference of 0.16%), Immigrants from Liberia ($87,739, a difference of 0.20%), Spanish American ($87,836, a difference of 0.31%), and Immigrants from Micronesia ($87,864, a difference of 0.35%).
| Demographics | Rating | Rank | Householder Income Ages 45 - 64 years |
| Immigrants | West Indies | 0.2 /100 | #266 | Tragic $88,164 |
| Hmong | 0.2 /100 | #267 | Tragic $88,115 |
| Immigrants | Micronesia | 0.2 /100 | #268 | Tragic $87,864 |
| Spanish Americans | 0.2 /100 | #269 | Tragic $87,836 |
| Immigrants | Liberia | 0.2 /100 | #270 | Tragic $87,739 |
| Guatemalans | 0.2 /100 | #271 | Tragic $87,705 |
| Cape Verdeans | 0.2 /100 | #272 | Tragic $87,580 |
| Spanish American Indians | 0.2 /100 | #273 | Tragic $87,561 |
| Iroquois | 0.1 /100 | #274 | Tragic $87,255 |
| Immigrants | Belize | 0.1 /100 | #275 | Tragic $87,229 |
| Immigrants | Latin America | 0.1 /100 | #276 | Tragic $87,219 |
| Cree | 0.1 /100 | #277 | Tragic $87,185 |
| Immigrants | Jamaica | 0.1 /100 | #278 | Tragic $87,035 |
| Yakama | 0.1 /100 | #279 | Tragic $86,992 |
| Immigrants | Somalia | 0.1 /100 | #280 | Tragic $86,987 |