Immigrants from Sierra Leone vs Thai Householder Income Ages 45 - 64 years
COMPARE
Immigrants from Sierra Leone
Thai
Householder Income Ages 45 - 64 years
Householder Income Ages 45 - 64 years Comparison
Immigrants from Sierra Leone
Thais
$103,227
HOUSEHOLDER INCOME AGES 45 - 64 YEARS
81.1/ 100
METRIC RATING
149th/ 347
METRIC RANK
$129,560
HOUSEHOLDER INCOME AGES 45 - 64 YEARS
100.0/ 100
METRIC RATING
4th/ 347
METRIC RANK
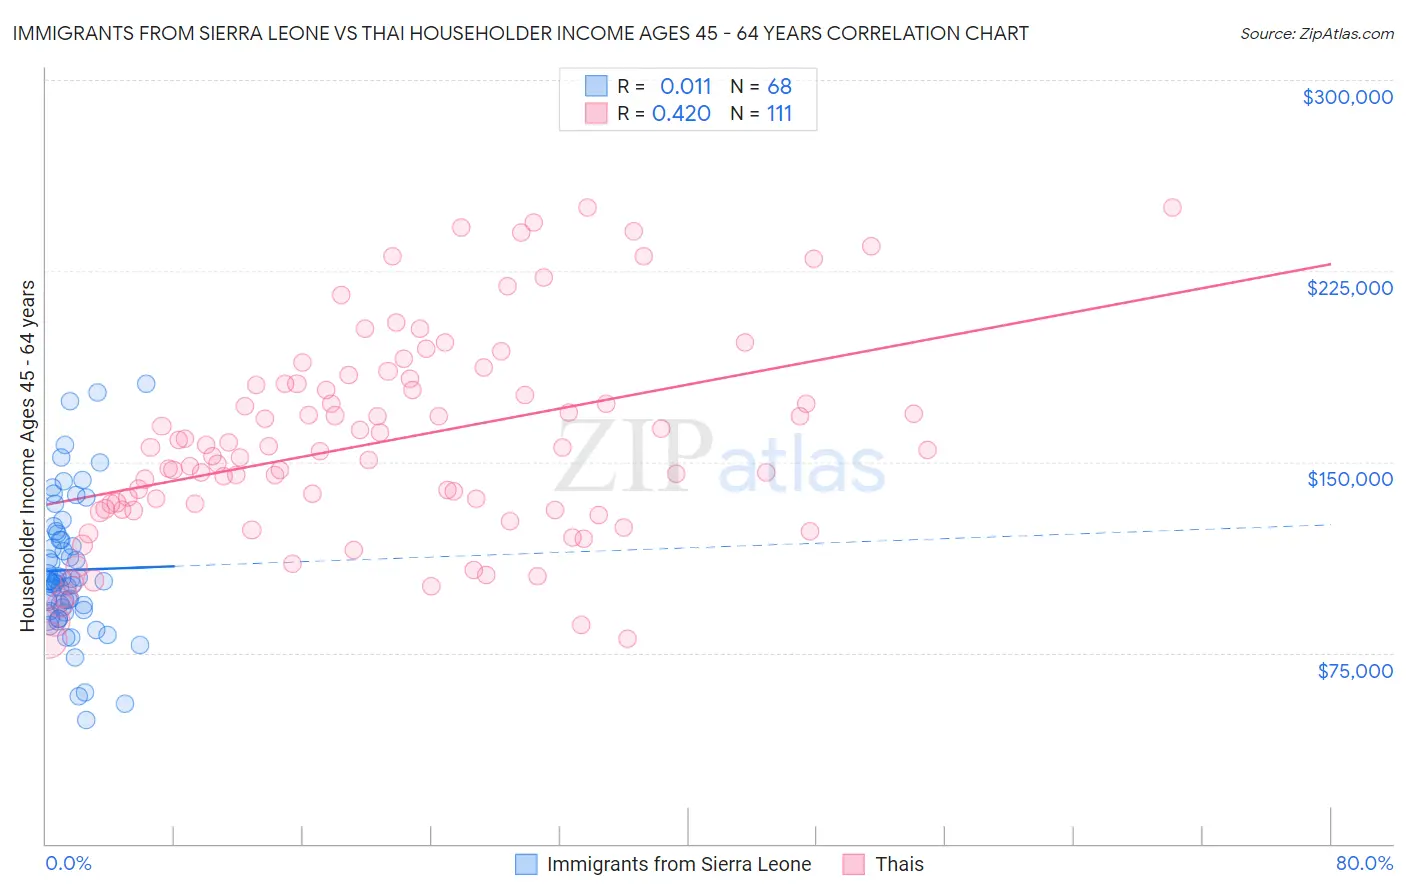
Immigrants from Sierra Leone vs Thai Householder Income Ages 45 - 64 years Correlation Chart
The statistical analysis conducted on geographies consisting of 101,631,094 people shows no correlation between the proportion of Immigrants from Sierra Leone and household income with householder between the ages 45 and 64 in the United States with a correlation coefficient (R) of 0.011 and weighted average of $103,227. Similarly, the statistical analysis conducted on geographies consisting of 474,584,420 people shows a moderate positive correlation between the proportion of Thais and household income with householder between the ages 45 and 64 in the United States with a correlation coefficient (R) of 0.420 and weighted average of $129,560, a difference of 25.5%.
Householder Income Ages 45 - 64 years Correlation Summary
| Measurement | Immigrants from Sierra Leone | Thai |
| Minimum | $48,831 | $80,277 |
| Maximum | $180,469 | $250,001 |
| Range | $131,638 | $169,724 |
| Mean | $107,504 | $158,060 |
| Median | $102,977 | $154,550 |
| Interquartile 25% (IQ1) | $91,548 | $131,303 |
| Interquartile 75% (IQ3) | $120,393 | $180,581 |
| Interquartile Range (IQR) | $28,845 | $49,278 |
| Standard Deviation (Sample) | $27,099 | $39,812 |
| Standard Deviation (Population) | $26,899 | $39,632 |
Similar Demographics by Householder Income Ages 45 - 64 years
Demographics Similar to Immigrants from Sierra Leone by Householder Income Ages 45 - 64 years
In terms of householder income ages 45 - 64 years, the demographic groups most similar to Immigrants from Sierra Leone are Immigrants from Germany ($103,282, a difference of 0.050%), Immigrants from Peru ($103,173, a difference of 0.050%), Basque ($103,387, a difference of 0.15%), Swiss ($103,071, a difference of 0.15%), and Irish ($103,067, a difference of 0.16%).
| Demographics | Rating | Rank | Householder Income Ages 45 - 64 years |
| Luxembourgers | 83.3 /100 | #142 | Excellent $103,536 |
| Serbians | 83.2 /100 | #143 | Excellent $103,522 |
| Czechs | 83.1 /100 | #144 | Excellent $103,507 |
| Ugandans | 82.9 /100 | #145 | Excellent $103,472 |
| Immigrants | Chile | 82.5 /100 | #146 | Excellent $103,412 |
| Basques | 82.3 /100 | #147 | Excellent $103,387 |
| Immigrants | Germany | 81.5 /100 | #148 | Excellent $103,282 |
| Immigrants | Sierra Leone | 81.1 /100 | #149 | Excellent $103,227 |
| Immigrants | Peru | 80.7 /100 | #150 | Excellent $103,173 |
| Swiss | 79.9 /100 | #151 | Good $103,071 |
| Irish | 79.8 /100 | #152 | Good $103,067 |
| Scandinavians | 79.0 /100 | #153 | Good $102,969 |
| Slovenes | 78.3 /100 | #154 | Good $102,885 |
| Costa Ricans | 77.4 /100 | #155 | Good $102,779 |
| Carpatho Rusyns | 77.4 /100 | #156 | Good $102,777 |
Demographics Similar to Thais by Householder Income Ages 45 - 64 years
In terms of householder income ages 45 - 64 years, the demographic groups most similar to Thais are Immigrants from Singapore ($129,514, a difference of 0.040%), Iranian ($129,350, a difference of 0.16%), Immigrants from Hong Kong ($127,500, a difference of 1.6%), Immigrants from Iran ($126,940, a difference of 2.1%), and Immigrants from India ($132,488, a difference of 2.3%).
| Demographics | Rating | Rank | Householder Income Ages 45 - 64 years |
| Immigrants | Taiwan | 100.0 /100 | #1 | Exceptional $135,508 |
| Filipinos | 100.0 /100 | #2 | Exceptional $134,910 |
| Immigrants | India | 100.0 /100 | #3 | Exceptional $132,488 |
| Thais | 100.0 /100 | #4 | Exceptional $129,560 |
| Immigrants | Singapore | 100.0 /100 | #5 | Exceptional $129,514 |
| Iranians | 100.0 /100 | #6 | Exceptional $129,350 |
| Immigrants | Hong Kong | 100.0 /100 | #7 | Exceptional $127,500 |
| Immigrants | Iran | 100.0 /100 | #8 | Exceptional $126,940 |
| Okinawans | 100.0 /100 | #9 | Exceptional $124,796 |
| Immigrants | South Central Asia | 100.0 /100 | #10 | Exceptional $124,188 |
| Cypriots | 100.0 /100 | #11 | Exceptional $123,396 |
| Immigrants | Israel | 100.0 /100 | #12 | Exceptional $122,893 |
| Immigrants | Ireland | 100.0 /100 | #13 | Exceptional $122,757 |
| Indians (Asian) | 100.0 /100 | #14 | Exceptional $122,343 |
| Immigrants | Eastern Asia | 100.0 /100 | #15 | Exceptional $122,222 |