Immigrants from Jamaica vs Immigrants from Uzbekistan Householder Income Ages 25 - 44 years
COMPARE
Immigrants from Jamaica
Immigrants from Uzbekistan
Householder Income Ages 25 - 44 years
Householder Income Ages 25 - 44 years Comparison
Immigrants from Jamaica
Immigrants from Uzbekistan
$83,298
HOUSEHOLDER INCOME AGES 25 - 44 YEARS
0.2/ 100
METRIC RATING
275th/ 347
METRIC RANK
$98,849
HOUSEHOLDER INCOME AGES 25 - 44 YEARS
91.5/ 100
METRIC RATING
122nd/ 347
METRIC RANK
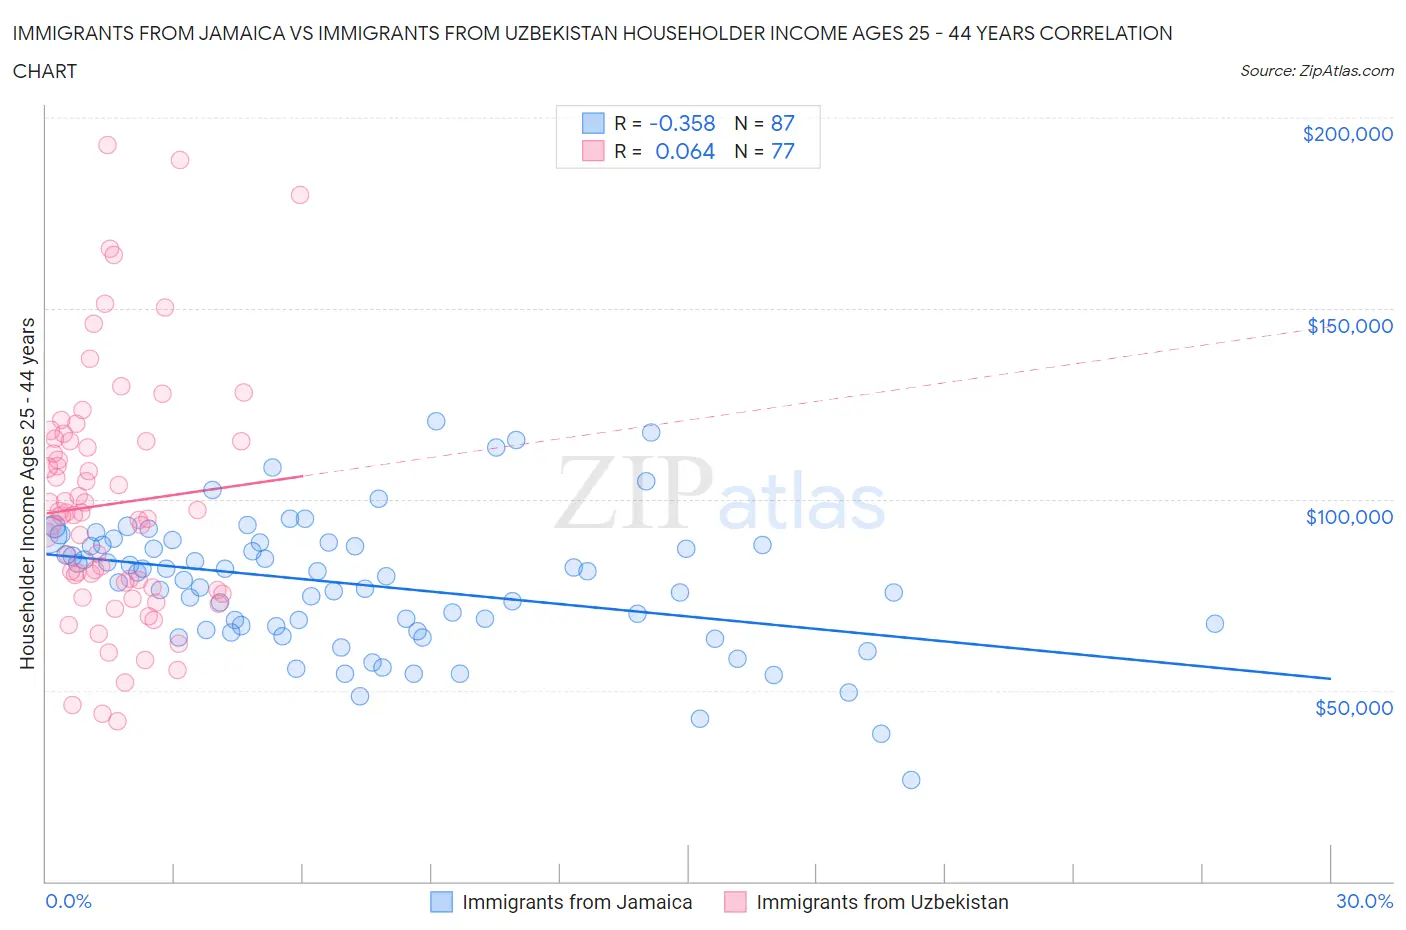
Immigrants from Jamaica vs Immigrants from Uzbekistan Householder Income Ages 25 - 44 years Correlation Chart
The statistical analysis conducted on geographies consisting of 301,176,975 people shows a mild negative correlation between the proportion of Immigrants from Jamaica and household income with householder between the ages 25 and 44 in the United States with a correlation coefficient (R) of -0.358 and weighted average of $83,298. Similarly, the statistical analysis conducted on geographies consisting of 118,660,152 people shows a slight positive correlation between the proportion of Immigrants from Uzbekistan and household income with householder between the ages 25 and 44 in the United States with a correlation coefficient (R) of 0.064 and weighted average of $98,849, a difference of 18.7%.
Householder Income Ages 25 - 44 years Correlation Summary
| Measurement | Immigrants from Jamaica | Immigrants from Uzbekistan |
| Minimum | $26,453 | $41,890 |
| Maximum | $120,529 | $192,849 |
| Range | $94,076 | $150,959 |
| Mean | $77,647 | $98,791 |
| Median | $79,814 | $95,849 |
| Interquartile 25% (IQ1) | $65,677 | $76,528 |
| Interquartile 75% (IQ3) | $88,119 | $115,337 |
| Interquartile Range (IQR) | $22,442 | $38,808 |
| Standard Deviation (Sample) | $17,482 | $32,098 |
| Standard Deviation (Population) | $17,381 | $31,889 |
Similar Demographics by Householder Income Ages 25 - 44 years
Demographics Similar to Immigrants from Jamaica by Householder Income Ages 25 - 44 years
In terms of householder income ages 25 - 44 years, the demographic groups most similar to Immigrants from Jamaica are Immigrants from Belize ($83,141, a difference of 0.19%), Marshallese ($83,575, a difference of 0.33%), Paiute ($82,984, a difference of 0.38%), Iroquois ($83,682, a difference of 0.46%), and Spanish American ($83,722, a difference of 0.51%).
| Demographics | Rating | Rank | Householder Income Ages 25 - 44 years |
| Sub-Saharan Africans | 0.3 /100 | #268 | Tragic $84,235 |
| Spanish American Indians | 0.3 /100 | #269 | Tragic $84,085 |
| Jamaicans | 0.3 /100 | #270 | Tragic $83,933 |
| Somalis | 0.2 /100 | #271 | Tragic $83,752 |
| Spanish Americans | 0.2 /100 | #272 | Tragic $83,722 |
| Iroquois | 0.2 /100 | #273 | Tragic $83,682 |
| Marshallese | 0.2 /100 | #274 | Tragic $83,575 |
| Immigrants | Jamaica | 0.2 /100 | #275 | Tragic $83,298 |
| Immigrants | Belize | 0.2 /100 | #276 | Tragic $83,141 |
| Paiute | 0.2 /100 | #277 | Tragic $82,984 |
| Senegalese | 0.2 /100 | #278 | Tragic $82,852 |
| Pima | 0.1 /100 | #279 | Tragic $82,821 |
| Colville | 0.1 /100 | #280 | Tragic $82,604 |
| Cajuns | 0.1 /100 | #281 | Tragic $82,393 |
| Central American Indians | 0.1 /100 | #282 | Tragic $82,355 |
Demographics Similar to Immigrants from Uzbekistan by Householder Income Ages 25 - 44 years
In terms of householder income ages 25 - 44 years, the demographic groups most similar to Immigrants from Uzbekistan are Peruvian ($98,886, a difference of 0.040%), Palestinian ($98,777, a difference of 0.070%), Zimbabwean ($98,586, a difference of 0.27%), Swedish ($99,136, a difference of 0.29%), and Jordanian ($99,186, a difference of 0.34%).
| Demographics | Rating | Rank | Householder Income Ages 25 - 44 years |
| Carpatho Rusyns | 93.7 /100 | #115 | Exceptional $99,449 |
| Portuguese | 93.7 /100 | #116 | Exceptional $99,429 |
| Immigrants | Northern Africa | 93.0 /100 | #117 | Exceptional $99,232 |
| Syrians | 92.9 /100 | #118 | Exceptional $99,215 |
| Jordanians | 92.8 /100 | #119 | Exceptional $99,186 |
| Swedes | 92.7 /100 | #120 | Exceptional $99,136 |
| Peruvians | 91.7 /100 | #121 | Exceptional $98,886 |
| Immigrants | Uzbekistan | 91.5 /100 | #122 | Exceptional $98,849 |
| Palestinians | 91.2 /100 | #123 | Exceptional $98,777 |
| Zimbabweans | 90.3 /100 | #124 | Exceptional $98,586 |
| Pakistanis | 89.3 /100 | #125 | Excellent $98,401 |
| British | 89.1 /100 | #126 | Excellent $98,359 |
| Serbians | 88.9 /100 | #127 | Excellent $98,320 |
| Europeans | 88.9 /100 | #128 | Excellent $98,310 |
| Brazilians | 88.6 /100 | #129 | Excellent $98,267 |