Immigrants from Senegal vs Inupiat Householder Income Over 65 years
COMPARE
Immigrants from Senegal
Inupiat
Householder Income Over 65 years
Householder Income Over 65 years Comparison
Immigrants from Senegal
Inupiat
$54,447
HOUSEHOLDER INCOME OVER 65 YEARS
0.1/ 100
METRIC RATING
270th/ 347
METRIC RANK
$61,061
HOUSEHOLDER INCOME OVER 65 YEARS
52.4/ 100
METRIC RATING
171st/ 347
METRIC RANK
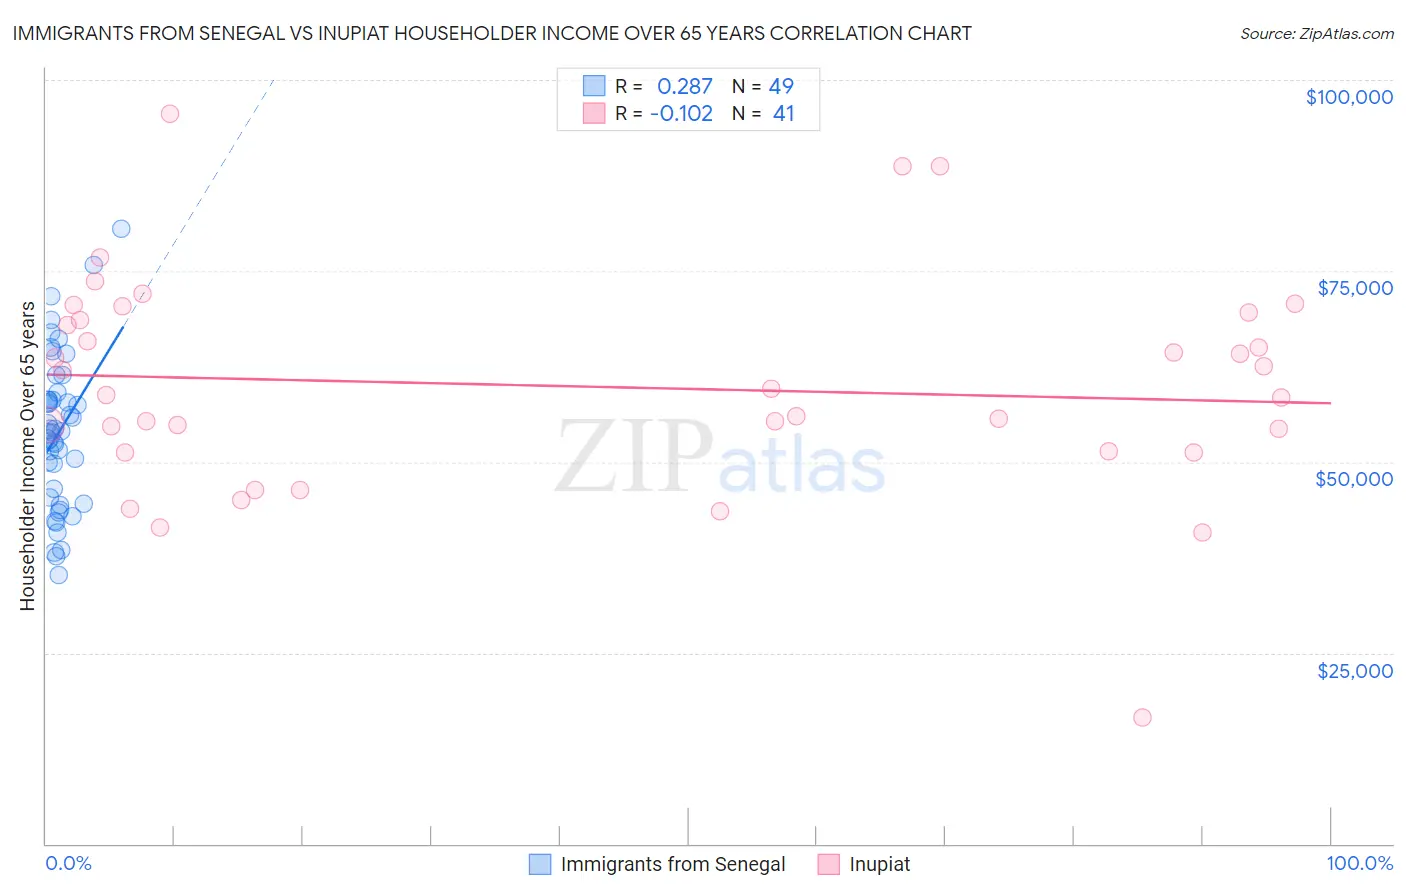
Immigrants from Senegal vs Inupiat Householder Income Over 65 years Correlation Chart
The statistical analysis conducted on geographies consisting of 90,018,715 people shows a weak positive correlation between the proportion of Immigrants from Senegal and household income with householder over the age of 65 in the United States with a correlation coefficient (R) of 0.287 and weighted average of $54,447. Similarly, the statistical analysis conducted on geographies consisting of 96,206,206 people shows a poor negative correlation between the proportion of Inupiat and household income with householder over the age of 65 in the United States with a correlation coefficient (R) of -0.102 and weighted average of $61,061, a difference of 12.1%.
Householder Income Over 65 years Correlation Summary
| Measurement | Immigrants from Senegal | Inupiat |
| Minimum | $35,208 | $16,607 |
| Maximum | $80,537 | $95,647 |
| Range | $45,329 | $79,040 |
| Mean | $53,928 | $59,905 |
| Median | $54,081 | $58,687 |
| Interquartile 25% (IQ1) | $44,902 | $51,307 |
| Interquartile 75% (IQ3) | $58,588 | $69,101 |
| Interquartile Range (IQR) | $13,686 | $17,794 |
| Standard Deviation (Sample) | $10,096 | $14,461 |
| Standard Deviation (Population) | $9,992 | $14,284 |
Similar Demographics by Householder Income Over 65 years
Demographics Similar to Immigrants from Senegal by Householder Income Over 65 years
In terms of householder income over 65 years, the demographic groups most similar to Immigrants from Senegal are Nicaraguan ($54,474, a difference of 0.050%), Immigrants from Zaire ($54,512, a difference of 0.12%), Guatemalan ($54,526, a difference of 0.15%), Liberian ($54,356, a difference of 0.17%), and Jamaican ($54,560, a difference of 0.21%).
| Demographics | Rating | Rank | Householder Income Over 65 years |
| French American Indians | 0.1 /100 | #263 | Tragic $54,699 |
| Apache | 0.1 /100 | #264 | Tragic $54,668 |
| Belizeans | 0.1 /100 | #265 | Tragic $54,580 |
| Jamaicans | 0.1 /100 | #266 | Tragic $54,560 |
| Guatemalans | 0.1 /100 | #267 | Tragic $54,526 |
| Immigrants | Zaire | 0.1 /100 | #268 | Tragic $54,512 |
| Nicaraguans | 0.1 /100 | #269 | Tragic $54,474 |
| Immigrants | Senegal | 0.1 /100 | #270 | Tragic $54,447 |
| Liberians | 0.1 /100 | #271 | Tragic $54,356 |
| Potawatomi | 0.1 /100 | #272 | Tragic $54,212 |
| Indonesians | 0.1 /100 | #273 | Tragic $54,176 |
| Barbadians | 0.1 /100 | #274 | Tragic $54,163 |
| Cherokee | 0.1 /100 | #275 | Tragic $54,133 |
| Cree | 0.1 /100 | #276 | Tragic $54,129 |
| Cheyenne | 0.1 /100 | #277 | Tragic $54,096 |
Demographics Similar to Inupiat by Householder Income Over 65 years
In terms of householder income over 65 years, the demographic groups most similar to Inupiat are Immigrants from Poland ($61,041, a difference of 0.030%), Serbian ($61,087, a difference of 0.040%), Carpatho Rusyn ($61,093, a difference of 0.050%), Irish ($61,097, a difference of 0.060%), and Norwegian ($61,104, a difference of 0.070%).
| Demographics | Rating | Rank | Householder Income Over 65 years |
| Immigrants | North Macedonia | 55.4 /100 | #164 | Average $61,175 |
| Immigrants | Ukraine | 55.1 /100 | #165 | Average $61,163 |
| Immigrants | Eastern Africa | 55.0 /100 | #166 | Average $61,157 |
| Norwegians | 53.6 /100 | #167 | Average $61,104 |
| Irish | 53.4 /100 | #168 | Average $61,097 |
| Carpatho Rusyns | 53.3 /100 | #169 | Average $61,093 |
| Serbians | 53.1 /100 | #170 | Average $61,087 |
| Inupiat | 52.4 /100 | #171 | Average $61,061 |
| Immigrants | Poland | 51.9 /100 | #172 | Average $61,041 |
| Immigrants | Micronesia | 50.8 /100 | #173 | Average $61,000 |
| Luxembourgers | 50.0 /100 | #174 | Average $60,967 |
| Spaniards | 47.3 /100 | #175 | Average $60,866 |
| Spanish | 45.5 /100 | #176 | Average $60,795 |
| Alaska Natives | 44.3 /100 | #177 | Average $60,748 |
| Yup'ik | 43.7 /100 | #178 | Average $60,727 |