Immigrants from Scotland vs Colville Householder Income Over 65 years
COMPARE
Immigrants from Scotland
Colville
Householder Income Over 65 years
Householder Income Over 65 years Comparison
Immigrants from Scotland
Colville
$66,620
HOUSEHOLDER INCOME OVER 65 YEARS
99.7/ 100
METRIC RATING
52nd/ 347
METRIC RANK
$51,739
HOUSEHOLDER INCOME OVER 65 YEARS
0.0/ 100
METRIC RATING
320th/ 347
METRIC RANK
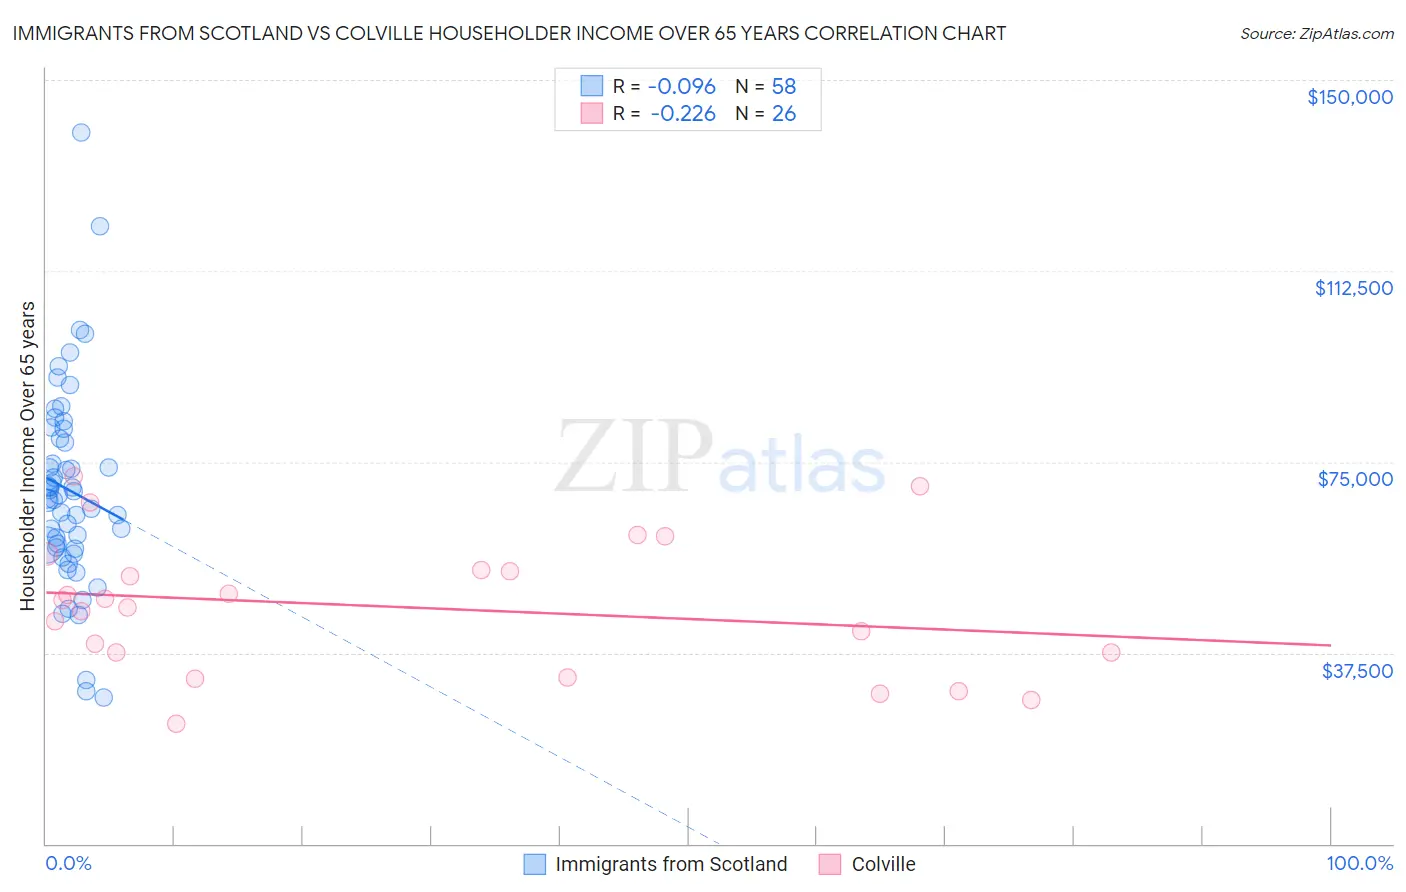
Immigrants from Scotland vs Colville Householder Income Over 65 years Correlation Chart
The statistical analysis conducted on geographies consisting of 196,236,719 people shows a slight negative correlation between the proportion of Immigrants from Scotland and household income with householder over the age of 65 in the United States with a correlation coefficient (R) of -0.096 and weighted average of $66,620. Similarly, the statistical analysis conducted on geographies consisting of 34,655,374 people shows a weak negative correlation between the proportion of Colville and household income with householder over the age of 65 in the United States with a correlation coefficient (R) of -0.226 and weighted average of $51,739, a difference of 28.8%.
Householder Income Over 65 years Correlation Summary
| Measurement | Immigrants from Scotland | Colville |
| Minimum | $28,672 | $23,676 |
| Maximum | $139,643 | $72,281 |
| Range | $110,971 | $48,605 |
| Mean | $69,451 | $46,521 |
| Median | $68,138 | $47,145 |
| Interquartile 25% (IQ1) | $58,075 | $37,500 |
| Interquartile 75% (IQ3) | $79,459 | $53,832 |
| Interquartile Range (IQR) | $21,384 | $16,332 |
| Standard Deviation (Sample) | $19,829 | $13,193 |
| Standard Deviation (Population) | $19,657 | $12,937 |
Similar Demographics by Householder Income Over 65 years
Demographics Similar to Immigrants from Scotland by Householder Income Over 65 years
In terms of householder income over 65 years, the demographic groups most similar to Immigrants from Scotland are Immigrants from Pakistan ($66,617, a difference of 0.0%), Israeli ($66,636, a difference of 0.020%), Immigrants from Turkey ($66,672, a difference of 0.080%), Immigrants from Indonesia ($66,694, a difference of 0.11%), and Immigrants from Netherlands ($66,463, a difference of 0.24%).
| Demographics | Rating | Rank | Householder Income Over 65 years |
| Immigrants | Afghanistan | 99.8 /100 | #45 | Exceptional $67,007 |
| Cambodians | 99.8 /100 | #46 | Exceptional $66,892 |
| Australians | 99.8 /100 | #47 | Exceptional $66,891 |
| Immigrants | France | 99.8 /100 | #48 | Exceptional $66,826 |
| Immigrants | Indonesia | 99.8 /100 | #49 | Exceptional $66,694 |
| Immigrants | Turkey | 99.7 /100 | #50 | Exceptional $66,672 |
| Israelis | 99.7 /100 | #51 | Exceptional $66,636 |
| Immigrants | Scotland | 99.7 /100 | #52 | Exceptional $66,620 |
| Immigrants | Pakistan | 99.7 /100 | #53 | Exceptional $66,617 |
| Immigrants | Netherlands | 99.7 /100 | #54 | Exceptional $66,463 |
| Immigrants | Czechoslovakia | 99.7 /100 | #55 | Exceptional $66,376 |
| Laotians | 99.6 /100 | #56 | Exceptional $66,306 |
| Bulgarians | 99.6 /100 | #57 | Exceptional $66,236 |
| Immigrants | Philippines | 99.6 /100 | #58 | Exceptional $66,161 |
| Immigrants | Norway | 99.5 /100 | #59 | Exceptional $66,118 |
Demographics Similar to Colville by Householder Income Over 65 years
In terms of householder income over 65 years, the demographic groups most similar to Colville are Menominee ($51,719, a difference of 0.040%), Immigrants from Honduras ($51,888, a difference of 0.29%), Haitian ($51,912, a difference of 0.33%), Immigrants from St. Vincent and the Grenadines ($51,922, a difference of 0.35%), and Creek ($51,949, a difference of 0.41%).
| Demographics | Rating | Rank | Householder Income Over 65 years |
| Immigrants | Nicaragua | 0.0 /100 | #313 | Tragic $52,085 |
| Natives/Alaskans | 0.0 /100 | #314 | Tragic $52,081 |
| U.S. Virgin Islanders | 0.0 /100 | #315 | Tragic $52,072 |
| Creek | 0.0 /100 | #316 | Tragic $51,949 |
| Immigrants | St. Vincent and the Grenadines | 0.0 /100 | #317 | Tragic $51,922 |
| Haitians | 0.0 /100 | #318 | Tragic $51,912 |
| Immigrants | Honduras | 0.0 /100 | #319 | Tragic $51,888 |
| Colville | 0.0 /100 | #320 | Tragic $51,739 |
| Menominee | 0.0 /100 | #321 | Tragic $51,719 |
| British West Indians | 0.0 /100 | #322 | Tragic $51,463 |
| Cajuns | 0.0 /100 | #323 | Tragic $51,397 |
| Immigrants | Congo | 0.0 /100 | #324 | Tragic $51,393 |
| Immigrants | Haiti | 0.0 /100 | #325 | Tragic $51,219 |
| Kiowa | 0.0 /100 | #326 | Tragic $51,140 |
| Bahamians | 0.0 /100 | #327 | Tragic $51,000 |