Immigrants from Saudi Arabia vs Paiute Median Family Income
COMPARE
Immigrants from Saudi Arabia
Paiute
Median Family Income
Median Family Income Comparison
Immigrants from Saudi Arabia
Paiute
$108,544
MEDIAN FAMILY INCOME
95.2/ 100
METRIC RATING
113th/ 347
METRIC RANK
$85,414
MEDIAN FAMILY INCOME
0.0/ 100
METRIC RATING
305th/ 347
METRIC RANK
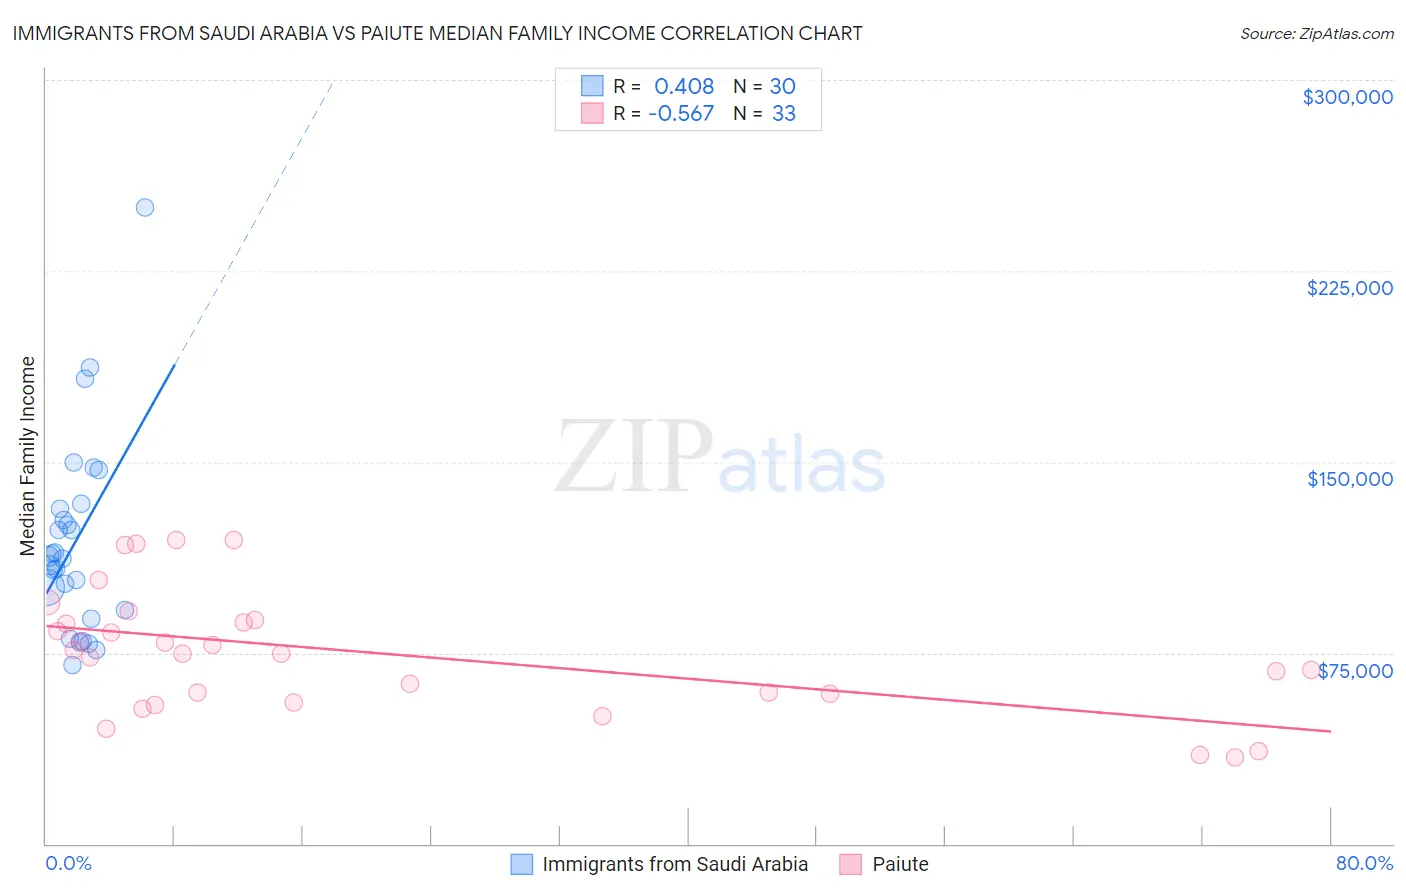
Immigrants from Saudi Arabia vs Paiute Median Family Income Correlation Chart
The statistical analysis conducted on geographies consisting of 164,179,276 people shows a moderate positive correlation between the proportion of Immigrants from Saudi Arabia and median family income in the United States with a correlation coefficient (R) of 0.408 and weighted average of $108,544. Similarly, the statistical analysis conducted on geographies consisting of 58,388,516 people shows a substantial negative correlation between the proportion of Paiute and median family income in the United States with a correlation coefficient (R) of -0.567 and weighted average of $85,414, a difference of 27.1%.
Median Family Income Correlation Summary
| Measurement | Immigrants from Saudi Arabia | Paiute |
| Minimum | $70,185 | $34,107 |
| Maximum | $250,001 | $119,375 |
| Range | $179,816 | $85,268 |
| Mean | $118,570 | $74,748 |
| Median | $112,390 | $74,830 |
| Interquartile 25% (IQ1) | $92,019 | $57,230 |
| Interquartile 75% (IQ3) | $131,535 | $87,390 |
| Interquartile Range (IQR) | $39,516 | $30,160 |
| Standard Deviation (Sample) | $38,218 | $23,830 |
| Standard Deviation (Population) | $37,576 | $23,466 |
Similar Demographics by Median Family Income
Demographics Similar to Immigrants from Saudi Arabia by Median Family Income
In terms of median family income, the demographic groups most similar to Immigrants from Saudi Arabia are Immigrants from Poland ($108,570, a difference of 0.020%), Polish ($108,507, a difference of 0.030%), Swedish ($108,499, a difference of 0.040%), Chilean ($108,429, a difference of 0.11%), and Immigrants from Western Asia ($108,691, a difference of 0.14%).
| Demographics | Rating | Rank | Median Family Income |
| Albanians | 96.4 /100 | #106 | Exceptional $109,136 |
| Immigrants | North Macedonia | 96.4 /100 | #107 | Exceptional $109,136 |
| Immigrants | Zimbabwe | 95.9 /100 | #108 | Exceptional $108,830 |
| Immigrants | Afghanistan | 95.6 /100 | #109 | Exceptional $108,709 |
| British | 95.6 /100 | #110 | Exceptional $108,705 |
| Immigrants | Western Asia | 95.6 /100 | #111 | Exceptional $108,691 |
| Immigrants | Poland | 95.3 /100 | #112 | Exceptional $108,570 |
| Immigrants | Saudi Arabia | 95.2 /100 | #113 | Exceptional $108,544 |
| Poles | 95.2 /100 | #114 | Exceptional $108,507 |
| Swedes | 95.1 /100 | #115 | Exceptional $108,499 |
| Chileans | 95.0 /100 | #116 | Exceptional $108,429 |
| Immigrants | Philippines | 94.6 /100 | #117 | Exceptional $108,288 |
| Ethiopians | 94.5 /100 | #118 | Exceptional $108,251 |
| Sri Lankans | 94.5 /100 | #119 | Exceptional $108,234 |
| Immigrants | Northern Africa | 94.3 /100 | #120 | Exceptional $108,161 |
Demographics Similar to Paiute by Median Family Income
In terms of median family income, the demographic groups most similar to Paiute are Immigrants from Dominica ($85,411, a difference of 0.0%), Chickasaw ($85,356, a difference of 0.070%), U.S. Virgin Islander ($85,294, a difference of 0.14%), Haitian ($85,218, a difference of 0.23%), and Mexican ($85,618, a difference of 0.24%).
| Demographics | Rating | Rank | Median Family Income |
| Immigrants | Latin America | 0.0 /100 | #298 | Tragic $86,989 |
| Chippewa | 0.0 /100 | #299 | Tragic $86,852 |
| Ottawa | 0.0 /100 | #300 | Tragic $86,380 |
| Colville | 0.0 /100 | #301 | Tragic $85,792 |
| Spanish American Indians | 0.0 /100 | #302 | Tragic $85,728 |
| Hispanics or Latinos | 0.0 /100 | #303 | Tragic $85,647 |
| Mexicans | 0.0 /100 | #304 | Tragic $85,618 |
| Paiute | 0.0 /100 | #305 | Tragic $85,414 |
| Immigrants | Dominica | 0.0 /100 | #306 | Tragic $85,411 |
| Chickasaw | 0.0 /100 | #307 | Tragic $85,356 |
| U.S. Virgin Islanders | 0.0 /100 | #308 | Tragic $85,294 |
| Haitians | 0.0 /100 | #309 | Tragic $85,218 |
| Immigrants | Central America | 0.0 /100 | #310 | Tragic $85,050 |
| Hondurans | 0.0 /100 | #311 | Tragic $85,004 |
| Cubans | 0.0 /100 | #312 | Tragic $84,981 |