Immigrants from Russia vs Immigrants from Poland Seniors Poverty Over the Age of 75
COMPARE
Immigrants from Russia
Immigrants from Poland
Seniors Poverty Over the Age of 75
Seniors Poverty Over the Age of 75 Comparison
Immigrants from Russia
Immigrants from Poland
13.4%
SENIORS POVERTY OVER THE AGE OF 75
0.6/ 100
METRIC RATING
241st/ 347
METRIC RANK
11.6%
SENIORS POVERTY OVER THE AGE OF 75
92.9/ 100
METRIC RATING
93rd/ 347
METRIC RANK
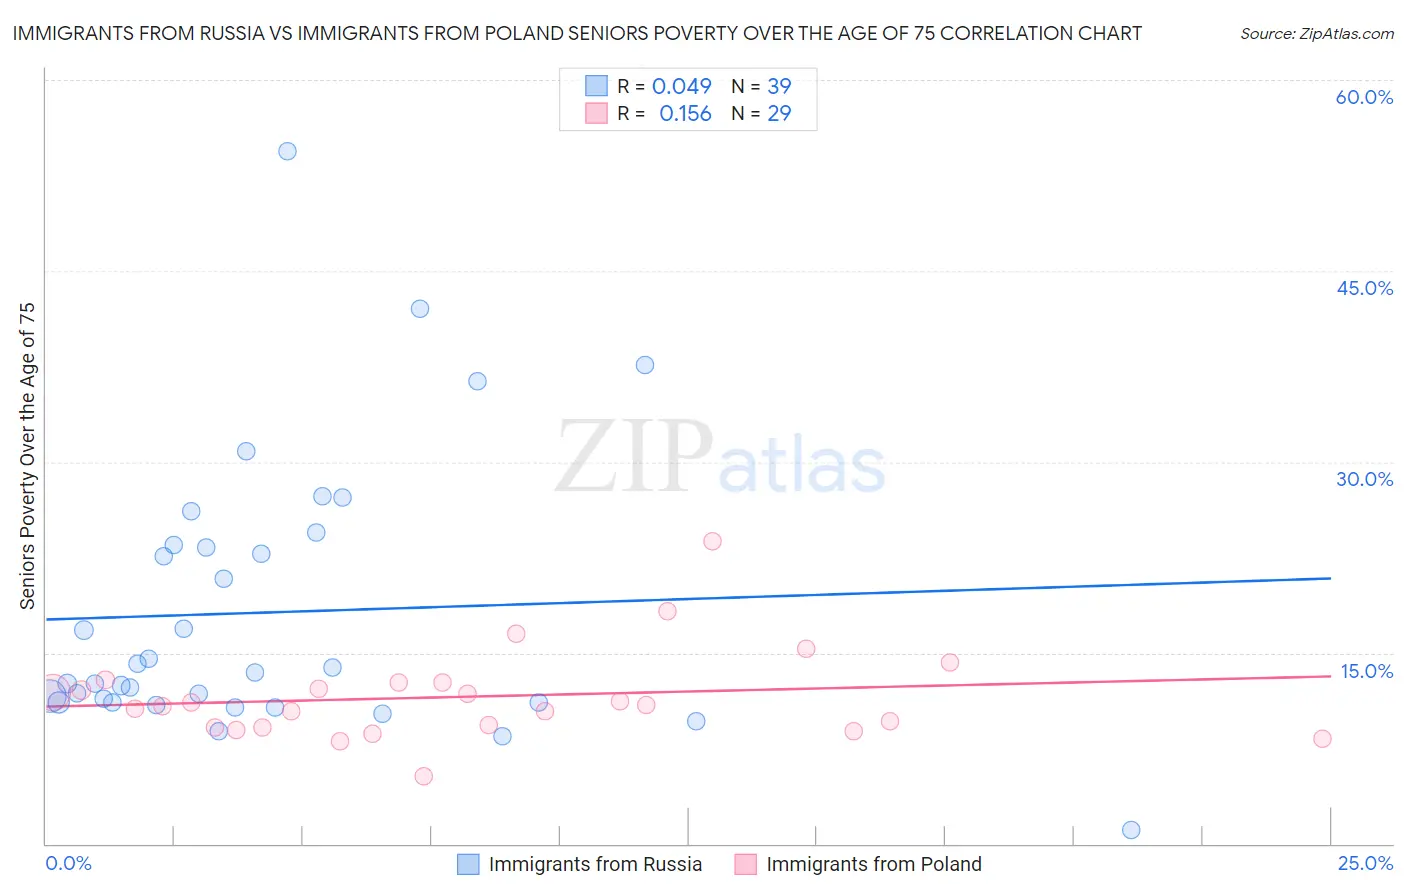
Immigrants from Russia vs Immigrants from Poland Seniors Poverty Over the Age of 75 Correlation Chart
The statistical analysis conducted on geographies consisting of 344,073,236 people shows no correlation between the proportion of Immigrants from Russia and poverty level among seniors over the age of 75 in the United States with a correlation coefficient (R) of 0.049 and weighted average of 13.4%. Similarly, the statistical analysis conducted on geographies consisting of 302,061,264 people shows a poor positive correlation between the proportion of Immigrants from Poland and poverty level among seniors over the age of 75 in the United States with a correlation coefficient (R) of 0.156 and weighted average of 11.6%, a difference of 16.4%.
Seniors Poverty Over the Age of 75 Correlation Summary
| Measurement | Immigrants from Russia | Immigrants from Poland |
| Minimum | 1.1% | 5.3% |
| Maximum | 54.4% | 23.7% |
| Range | 53.3% | 18.5% |
| Mean | 18.2% | 11.5% |
| Median | 13.4% | 10.9% |
| Interquartile 25% (IQ1) | 11.1% | 9.1% |
| Interquartile 75% (IQ3) | 23.4% | 12.7% |
| Interquartile Range (IQR) | 12.4% | 3.5% |
| Standard Deviation (Sample) | 10.8% | 3.6% |
| Standard Deviation (Population) | 10.7% | 3.5% |
Similar Demographics by Seniors Poverty Over the Age of 75
Demographics Similar to Immigrants from Russia by Seniors Poverty Over the Age of 75
In terms of seniors poverty over the age of 75, the demographic groups most similar to Immigrants from Russia are Immigrants from Somalia (13.5%, a difference of 0.10%), Dutch West Indian (13.5%, a difference of 0.12%), Argentinean (13.4%, a difference of 0.14%), Spanish American (13.5%, a difference of 0.44%), and Panamanian (13.4%, a difference of 0.45%).
| Demographics | Rating | Rank | Seniors Poverty Over the Age of 75 |
| Immigrants | Israel | 1.1 /100 | #234 | Tragic 13.3% |
| Japanese | 0.9 /100 | #235 | Tragic 13.3% |
| Moroccans | 0.9 /100 | #236 | Tragic 13.3% |
| Alaskan Athabascans | 0.8 /100 | #237 | Tragic 13.4% |
| Peruvians | 0.8 /100 | #238 | Tragic 13.4% |
| Panamanians | 0.8 /100 | #239 | Tragic 13.4% |
| Argentineans | 0.7 /100 | #240 | Tragic 13.4% |
| Immigrants | Russia | 0.6 /100 | #241 | Tragic 13.4% |
| Immigrants | Somalia | 0.6 /100 | #242 | Tragic 13.5% |
| Dutch West Indians | 0.6 /100 | #243 | Tragic 13.5% |
| Spanish Americans | 0.5 /100 | #244 | Tragic 13.5% |
| Uruguayans | 0.5 /100 | #245 | Tragic 13.5% |
| Immigrants | Cambodia | 0.4 /100 | #246 | Tragic 13.6% |
| Immigrants | Ukraine | 0.3 /100 | #247 | Tragic 13.6% |
| Africans | 0.3 /100 | #248 | Tragic 13.6% |
Demographics Similar to Immigrants from Poland by Seniors Poverty Over the Age of 75
In terms of seniors poverty over the age of 75, the demographic groups most similar to Immigrants from Poland are Creek (11.6%, a difference of 0.050%), Immigrants from Bosnia and Herzegovina (11.6%, a difference of 0.090%), Immigrants from Sweden (11.6%, a difference of 0.090%), Romanian (11.6%, a difference of 0.17%), and Immigrants from Japan (11.6%, a difference of 0.29%).
| Demographics | Rating | Rank | Seniors Poverty Over the Age of 75 |
| Australians | 94.6 /100 | #86 | Exceptional 11.5% |
| Koreans | 94.5 /100 | #87 | Exceptional 11.5% |
| Immigrants | Croatia | 94.5 /100 | #88 | Exceptional 11.5% |
| Immigrants | Sri Lanka | 94.4 /100 | #89 | Exceptional 11.5% |
| Aleuts | 94.1 /100 | #90 | Exceptional 11.5% |
| Immigrants | Germany | 94.1 /100 | #91 | Exceptional 11.5% |
| Kenyans | 93.9 /100 | #92 | Exceptional 11.5% |
| Immigrants | Poland | 92.9 /100 | #93 | Exceptional 11.6% |
| Creek | 92.7 /100 | #94 | Exceptional 11.6% |
| Immigrants | Bosnia and Herzegovina | 92.6 /100 | #95 | Exceptional 11.6% |
| Immigrants | Sweden | 92.6 /100 | #96 | Exceptional 11.6% |
| Romanians | 92.3 /100 | #97 | Exceptional 11.6% |
| Immigrants | Japan | 91.9 /100 | #98 | Exceptional 11.6% |
| Immigrants | Ethiopia | 91.7 /100 | #99 | Exceptional 11.6% |
| Syrians | 91.1 /100 | #100 | Exceptional 11.6% |