Immigrants from Russia vs Immigrants from Peru Householder Income Ages 25 - 44 years

COMPARE

Immigrants from Russia
Race
Ancestry
AfghanAfricanAlaska NativeAlaskan AthabascanAlbanianAleutAlsatianAmericanApacheArabArapahoArgentineanArmenianAssyrian/Chaldean/SyriacAustralianAustrianBahamianBangladeshiBarbadianBasqueBelgianBelizeanBermudanBhutaneseBlackfeetBolivianBrazilianBritishBritish West IndianBulgarianBurmeseCajunCambodianCanadianCape VerdeanCarpatho RusynCelticCentral AmericanCentral American IndianCherokeeCheyenneChickasawChileanChineseChippewaChoctawColombianColvilleComancheCosta RicanCreeCreekCroatianCrowCubanCypriotCzechCzechoslovakianDanishDelawareDominicanDutchDutch West IndianEastern EuropeanEcuadorianEgyptianEnglishEstonianEthiopianEuropeanFijianFilipinoFinnishFrenchFrench American IndianFrench CanadianGermanGerman RussianGhanaianGreekGuamanian/ChamorroGuatemalanGuyaneseHaitianHmongHonduranHopiHoumaHungarianIcelanderIndian (Asian)IndonesianInupiatIranianIraqiIrishIroquoisIsraeliItalianJamaicanJapaneseJordanianKenyanKiowaKoreanLaotianLatvianLebaneseLiberianLithuanianLumbeeLuxembourgerMacedonianMalaysianMalteseMarshalleseMenomineeMexicanMexican American IndianMongolianMoroccanNative HawaiianNavajoNepaleseNew ZealanderNicaraguanNigerianNorthern EuropeanNorwegianOkinawanOsageOttawaPaiutePakistaniPalestinianPanamanianParaguayanPennsylvania GermanPeruvianPimaPolishPortuguesePotawatomiPuebloPuerto RicanPuget Sound SalishRomanianRussianSalvadoranSamoanScandinavianScotch-IrishScottishSeminoleSenegaleseSerbianShoshoneSierra LeoneanSiouxSlavicSlovakSloveneSomaliSouth AfricanSouth AmericanSouth American IndianSoviet UnionSpaniardSpanishSpanish AmericanSpanish American IndianSri LankanSubsaharan AfricanSudaneseSwedishSwissSyrianTaiwaneseThaiTlingit-HaidaTohono O'OdhamTonganTrinidadian and TobagonianTsimshianTurkishU.S. Virgin IslanderUgandanUkrainianUruguayanUteVenezuelanVietnameseWelshWest IndianYakamaYaquiYugoslavianYumanYup'ikZimbabwean
Immigration
NonimmigrantsImmigrantsAfghanistanAfricaAlbaniaArgentinaArmeniaAsiaAustraliaAustriaBahamasBangladeshBarbadosBelarusBelgiumBelizeBoliviaBosnia and HerzegovinaBrazilBulgariaBurma/MyanmarCabo VerdeCambodiaCameroonCanadaCaribbeanCentral AmericaChileChinaColombiaCongoCosta RicaCroatiaCubaCzechoslovakiaDenmarkDominicaDominican RepublicEastern AfricaEastern AsiaEastern EuropeEcuadorEgyptEl SalvadorEnglandEritreaEthiopiaEuropeFijiFranceGermanyGhanaGreeceGrenadaGuatemalaGuyanaHaitiHondurasHong KongHungaryIndiaIndonesiaIranIraqIrelandIsraelItalyJamaicaJapanJordanKazakhstanKenyaKoreaKuwaitLaosLatin AmericaLatviaLebanonLiberiaLithuaniaMalaysiaMexicoMicronesiaMiddle AfricaMoldovaMoroccoNepalNetherlandsNicaraguaNigeriaNorth AmericaNorth MacedoniaNorthern AfricaNorthern EuropeNorwayOceaniaPakistanPanamaPhilippinesPolandPortugalRomaniaRussiaSaudi ArabiaScotlandSenegalSerbiaSierra LeoneSingaporeSomaliaSouth AfricaSouth AmericaSouth Central AsiaSouth Eastern AsiaSouthern EuropeSpainSri LankaSt. Vincent and the GrenadinesSudanSwedenSwitzerlandSyriaTaiwanThailandTrinidad and TobagoTurkeyUgandaUkraineUruguayUzbekistanVenezuelaVietnamWest IndiesWestern AfricaWestern AsiaWestern EuropeYemenZaireZimbabweAzores
Immigrants from Peru
Race
Ancestry
AfghanAfricanAlaska NativeAlaskan AthabascanAlbanianAleutAlsatianAmericanApacheArabArapahoArgentineanArmenianAssyrian/Chaldean/SyriacAustralianAustrianBahamianBangladeshiBarbadianBasqueBelgianBelizeanBermudanBhutaneseBlackfeetBolivianBrazilianBritishBritish West IndianBulgarianBurmeseCajunCambodianCanadianCape VerdeanCarpatho RusynCelticCentral AmericanCentral American IndianCherokeeCheyenneChickasawChileanChineseChippewaChoctawColombianColvilleComancheCosta RicanCreeCreekCroatianCrowCubanCypriotCzechCzechoslovakianDanishDelawareDominicanDutchDutch West IndianEastern EuropeanEcuadorianEgyptianEnglishEstonianEthiopianEuropeanFijianFilipinoFinnishFrenchFrench American IndianFrench CanadianGermanGerman RussianGhanaianGreekGuamanian/ChamorroGuatemalanGuyaneseHaitianHmongHonduranHopiHoumaHungarianIcelanderIndian (Asian)IndonesianInupiatIranianIraqiIrishIroquoisIsraeliItalianJamaicanJapaneseJordanianKenyanKiowaKoreanLaotianLatvianLebaneseLiberianLithuanianLumbeeLuxembourgerMacedonianMalaysianMalteseMarshalleseMenomineeMexicanMexican American IndianMongolianMoroccanNative HawaiianNavajoNepaleseNew ZealanderNicaraguanNigerianNorthern EuropeanNorwegianOkinawanOsageOttawaPaiutePakistaniPalestinianPanamanianParaguayanPennsylvania GermanPeruvianPimaPolishPortuguesePotawatomiPuebloPuerto RicanPuget Sound SalishRomanianRussianSalvadoranSamoanScandinavianScotch-IrishScottishSeminoleSenegaleseSerbianShoshoneSierra LeoneanSiouxSlavicSlovakSloveneSomaliSouth AfricanSouth AmericanSouth American IndianSoviet UnionSpaniardSpanishSpanish AmericanSpanish American IndianSri LankanSubsaharan AfricanSudaneseSwedishSwissSyrianTaiwaneseThaiTlingit-HaidaTohono O'OdhamTonganTrinidadian and TobagonianTsimshianTurkishU.S. Virgin IslanderUgandanUkrainianUruguayanUteVenezuelanVietnameseWelshWest IndianYakamaYaquiYugoslavianYumanYup'ikZimbabwean
Immigration
NonimmigrantsImmigrantsAfghanistanAfricaAlbaniaArgentinaArmeniaAsiaAustraliaAustriaBahamasBangladeshBarbadosBelarusBelgiumBelizeBoliviaBosnia and HerzegovinaBrazilBulgariaBurma/MyanmarCabo VerdeCambodiaCameroonCanadaCaribbeanCentral AmericaChileChinaColombiaCongoCosta RicaCroatiaCubaCzechoslovakiaDenmarkDominicaDominican RepublicEastern AfricaEastern AsiaEastern EuropeEcuadorEgyptEl SalvadorEnglandEritreaEthiopiaEuropeFijiFranceGermanyGhanaGreeceGrenadaGuatemalaGuyanaHaitiHondurasHong KongHungaryIndiaIndonesiaIranIraqIrelandIsraelItalyJamaicaJapanJordanKazakhstanKenyaKoreaKuwaitLaosLatin AmericaLatviaLebanonLiberiaLithuaniaMalaysiaMexicoMicronesiaMiddle AfricaMoldovaMoroccoNepalNetherlandsNicaraguaNigeriaNorth AmericaNorth MacedoniaNorthern AfricaNorthern EuropeNorwayOceaniaPakistanPanamaPeruPhilippinesPolandPortugalRomaniaSaudi ArabiaScotlandSenegalSerbiaSierra LeoneSingaporeSomaliaSouth AfricaSouth AmericaSouth Central AsiaSouth Eastern AsiaSouthern EuropeSpainSri LankaSt. Vincent and the GrenadinesSudanSwedenSwitzerlandSyriaTaiwanThailandTrinidad and TobagoTurkeyUgandaUkraineUruguayUzbekistanVenezuelaVietnamWest IndiesWestern AfricaWestern AsiaWestern EuropeYemenZaireZimbabweAzores
Householder Income Ages 25 - 44 years
Income
Poverty
Unemployment
Labor Participation
Family Structure
Vehicle Availability
Education Level
Disability

Householder Income Ages 25 - 44 years Comparison

Immigrants from Russia

Immigrants from Peru

Exceptional
Excellent
$108,751
HOUSEHOLDER INCOME AGES 25 - 44 YEARS
100.0/ 100
METRIC RATING
37th/ 347
METRIC RANK
$97,329
HOUSEHOLDER INCOME AGES 25 - 44 YEARS
82.2/ 100
METRIC RATING
139th/ 347
METRIC RANK

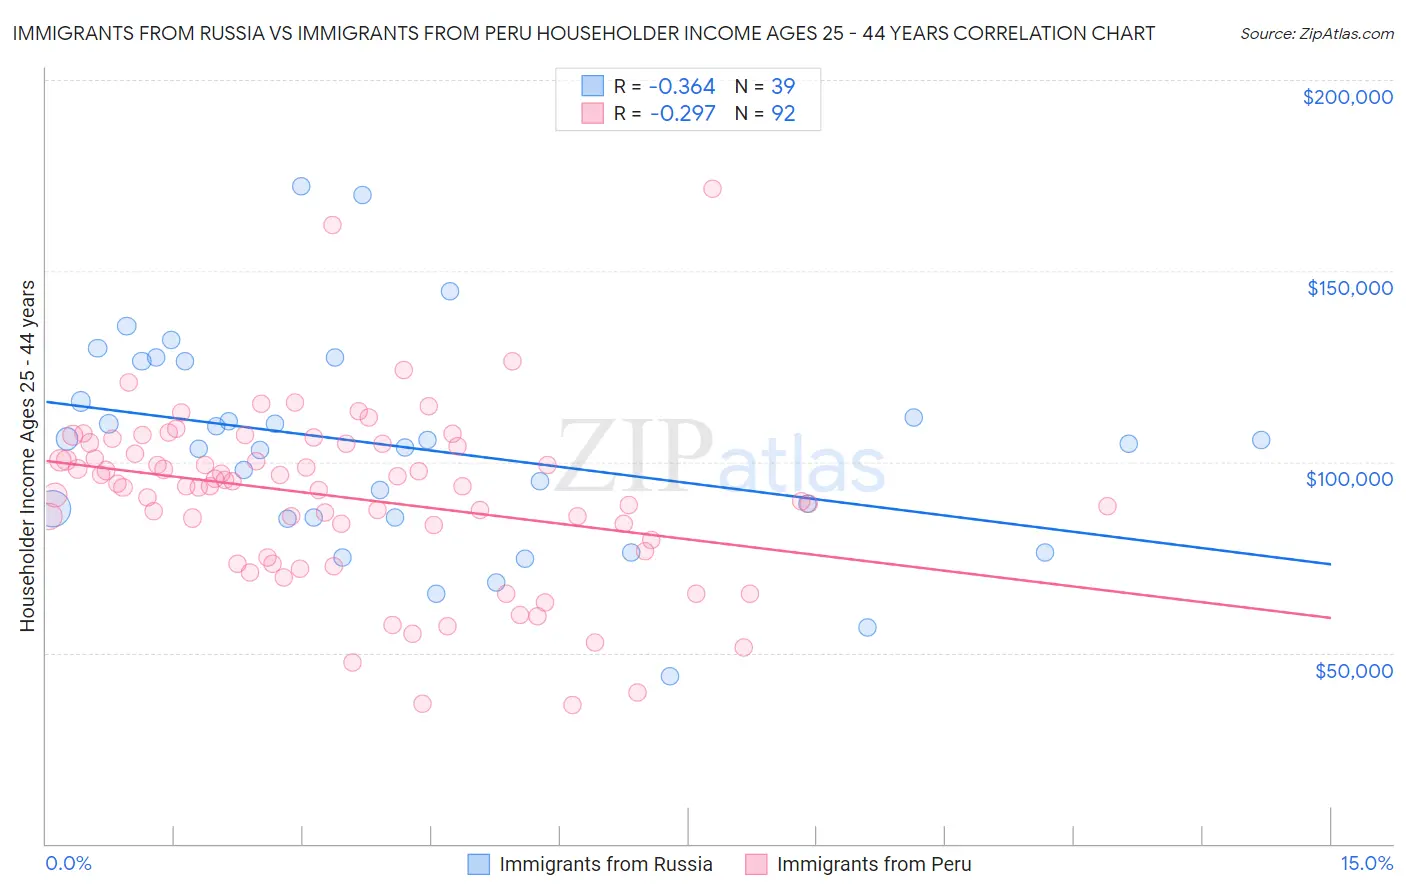
Immigrants from Russia vs Immigrants from Peru Householder Income Ages 25 - 44 years Correlation Chart

The statistical analysis conducted on geographies consisting of 347,220,944 people shows a mild negative correlation between the proportion of Immigrants from Russia and household income with householder between the ages 25 and 44 in the United States with a correlation coefficient (R) of -0.364 and weighted average of $108,751. Similarly, the statistical analysis conducted on geographies consisting of 328,285,431 people shows a weak negative correlation between the proportion of Immigrants from Peru and household income with householder between the ages 25 and 44 in the United States with a correlation coefficient (R) of -0.297 and weighted average of $97,329, a difference of 11.7%.
Immigrants from Russia vs Immigrants from Peru Householder Income Ages 25 - 44 years

Householder Income Ages 25 - 44 years Correlation Summary

MeasurementImmigrants from RussiaImmigrants from Peru
Minimum$43,724$36,176
Maximum$172,064$171,373
Range$128,340$135,197
Mean$103,731$90,702
Median$104,773$93,723
Interquartile 25% (IQ1)$85,291$77,980
Interquartile 75% (IQ3)$126,225$104,309
Interquartile Range (IQR)$40,934$26,329
Standard Deviation (Sample)$27,697$22,743
Standard Deviation (Population)$27,339$22,619

Similar Demographics by Householder Income Ages 25 - 44 years

Demographics Similar to Immigrants from Russia by Householder Income Ages 25 - 44 years

In terms of householder income ages 25 - 44 years, the demographic groups most similar to Immigrants from Russia are Latvian ($108,926, a difference of 0.16%), Soviet Union ($108,457, a difference of 0.27%), Immigrants from Switzerland ($109,185, a difference of 0.40%), Immigrants from France ($108,257, a difference of 0.46%), and Immigrants from Lithuania ($108,149, a difference of 0.56%).
DemographicsRating | RankHouseholder Income Ages 25 - 44 years
Immigrants | Greece
100.0
/100
|
#30
Exceptional
$110,103
Maltese
100.0
/100
|
#31
Exceptional
$110,064
Immigrants | Sri Lanka
100.0
/100
|
#32
Exceptional
$109,741
Bhutanese
100.0
/100
|
#33
Exceptional
$109,520
Bolivians
100.0
/100
|
#34
Exceptional
$109,372
Immigrants | Switzerland
100.0
/100
|
#35
Exceptional
$109,185
Latvians
100.0
/100
|
#36
Exceptional
$108,926
Immigrants | Russia
100.0
/100
|
#37
Exceptional
$108,751
Soviet Union
100.0
/100
|
#38
Exceptional
$108,457
Immigrants | France
99.9
/100
|
#39
Exceptional
$108,257
Immigrants | Lithuania
99.9
/100
|
#40
Exceptional
$108,149
Immigrants | Bolivia
99.9
/100
|
#41
Exceptional
$108,128
Australians
99.9
/100
|
#42
Exceptional
$107,912
Immigrants | Malaysia
99.9
/100
|
#43
Exceptional
$107,650
Immigrants | Indonesia
99.9
/100
|
#44
Exceptional
$107,627

Demographics Similar to Immigrants from Peru by Householder Income Ages 25 - 44 years

In terms of householder income ages 25 - 44 years, the demographic groups most similar to Immigrants from Peru are Lebanese ($97,339, a difference of 0.010%), Arab ($97,336, a difference of 0.010%), Immigrants from Morocco ($97,305, a difference of 0.020%), Luxembourger ($97,237, a difference of 0.090%), and Danish ($97,221, a difference of 0.11%).
DemographicsRating | RankHouseholder Income Ages 25 - 44 years
Immigrants | Zimbabwe
86.3
/100
|
#132
Excellent
$97,880
Tsimshian
85.8
/100
|
#133
Excellent
$97,809
Canadians
84.5
/100
|
#134
Excellent
$97,625
Immigrants | Oceania
84.5
/100
|
#135
Excellent
$97,623
Hungarians
83.9
/100
|
#136
Excellent
$97,544
Lebanese
82.3
/100
|
#137
Excellent
$97,339
Arabs
82.3
/100
|
#138
Excellent
$97,336
Immigrants | Peru
82.2
/100
|
#139
Excellent
$97,329
Immigrants | Morocco
82.0
/100
|
#140
Excellent
$97,305
Luxembourgers
81.5
/100
|
#141
Excellent
$97,237
Danes
81.3
/100
|
#142
Excellent
$97,221
Immigrants | Jordan
81.0
/100
|
#143
Excellent
$97,185
Immigrants | Chile
80.8
/100
|
#144
Excellent
$97,159
Norwegians
78.2
/100
|
#145
Good
$96,866
Ethiopians
77.8
/100
|
#146
Good
$96,824