Immigrants from Russia vs Bangladeshi Householder Income Ages 25 - 44 years
COMPARE
Immigrants from Russia
Bangladeshi
Householder Income Ages 25 - 44 years
Householder Income Ages 25 - 44 years Comparison
Immigrants from Russia
Bangladeshis
$108,751
HOUSEHOLDER INCOME AGES 25 - 44 YEARS
100.0/ 100
METRIC RATING
37th/ 347
METRIC RANK
$81,363
HOUSEHOLDER INCOME AGES 25 - 44 YEARS
0.1/ 100
METRIC RATING
295th/ 347
METRIC RANK
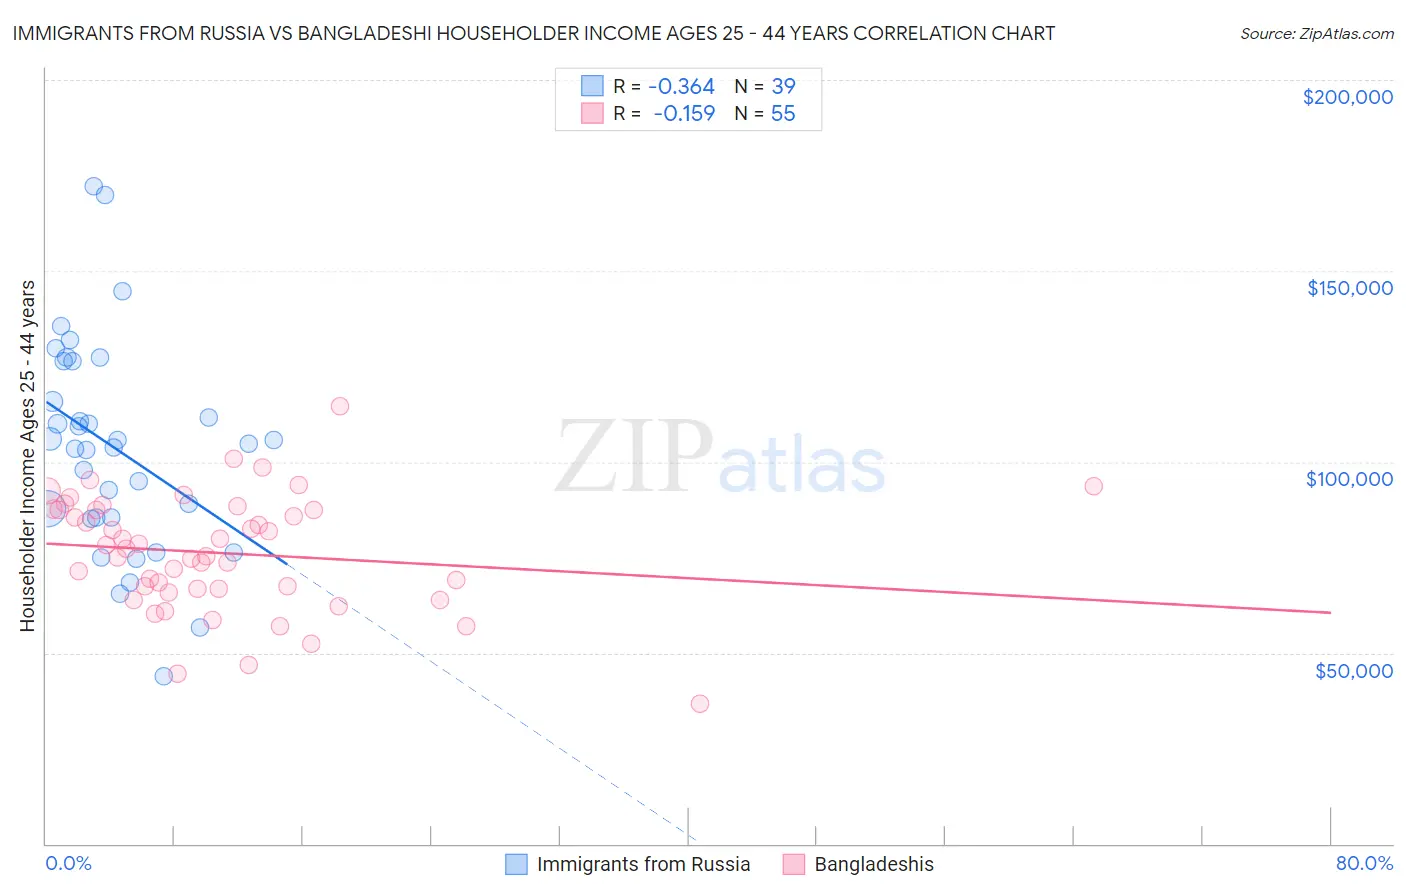
Immigrants from Russia vs Bangladeshi Householder Income Ages 25 - 44 years Correlation Chart
The statistical analysis conducted on geographies consisting of 347,220,944 people shows a mild negative correlation between the proportion of Immigrants from Russia and household income with householder between the ages 25 and 44 in the United States with a correlation coefficient (R) of -0.364 and weighted average of $108,751. Similarly, the statistical analysis conducted on geographies consisting of 141,274,107 people shows a poor negative correlation between the proportion of Bangladeshis and household income with householder between the ages 25 and 44 in the United States with a correlation coefficient (R) of -0.159 and weighted average of $81,363, a difference of 33.7%.
Householder Income Ages 25 - 44 years Correlation Summary
| Measurement | Immigrants from Russia | Bangladeshi |
| Minimum | $43,724 | $36,818 |
| Maximum | $172,064 | $114,417 |
| Range | $128,340 | $77,599 |
| Mean | $103,731 | $76,117 |
| Median | $104,773 | $77,308 |
| Interquartile 25% (IQ1) | $85,291 | $66,732 |
| Interquartile 75% (IQ3) | $126,225 | $87,531 |
| Interquartile Range (IQR) | $40,934 | $20,799 |
| Standard Deviation (Sample) | $27,697 | $15,116 |
| Standard Deviation (Population) | $27,339 | $14,978 |
Similar Demographics by Householder Income Ages 25 - 44 years
Demographics Similar to Immigrants from Russia by Householder Income Ages 25 - 44 years
In terms of householder income ages 25 - 44 years, the demographic groups most similar to Immigrants from Russia are Latvian ($108,926, a difference of 0.16%), Soviet Union ($108,457, a difference of 0.27%), Immigrants from Switzerland ($109,185, a difference of 0.40%), Immigrants from France ($108,257, a difference of 0.46%), and Immigrants from Lithuania ($108,149, a difference of 0.56%).
| Demographics | Rating | Rank | Householder Income Ages 25 - 44 years |
| Immigrants | Greece | 100.0 /100 | #30 | Exceptional $110,103 |
| Maltese | 100.0 /100 | #31 | Exceptional $110,064 |
| Immigrants | Sri Lanka | 100.0 /100 | #32 | Exceptional $109,741 |
| Bhutanese | 100.0 /100 | #33 | Exceptional $109,520 |
| Bolivians | 100.0 /100 | #34 | Exceptional $109,372 |
| Immigrants | Switzerland | 100.0 /100 | #35 | Exceptional $109,185 |
| Latvians | 100.0 /100 | #36 | Exceptional $108,926 |
| Immigrants | Russia | 100.0 /100 | #37 | Exceptional $108,751 |
| Soviet Union | 100.0 /100 | #38 | Exceptional $108,457 |
| Immigrants | France | 99.9 /100 | #39 | Exceptional $108,257 |
| Immigrants | Lithuania | 99.9 /100 | #40 | Exceptional $108,149 |
| Immigrants | Bolivia | 99.9 /100 | #41 | Exceptional $108,128 |
| Australians | 99.9 /100 | #42 | Exceptional $107,912 |
| Immigrants | Malaysia | 99.9 /100 | #43 | Exceptional $107,650 |
| Immigrants | Indonesia | 99.9 /100 | #44 | Exceptional $107,627 |
Demographics Similar to Bangladeshis by Householder Income Ages 25 - 44 years
In terms of householder income ages 25 - 44 years, the demographic groups most similar to Bangladeshis are Immigrants from Dominica ($81,351, a difference of 0.020%), Immigrants from Guatemala ($81,341, a difference of 0.030%), Cuban ($81,483, a difference of 0.15%), Dominican ($81,229, a difference of 0.17%), and Blackfeet ($81,531, a difference of 0.21%).
| Demographics | Rating | Rank | Householder Income Ages 25 - 44 years |
| Comanche | 0.1 /100 | #288 | Tragic $82,152 |
| Shoshone | 0.1 /100 | #289 | Tragic $82,062 |
| Liberians | 0.1 /100 | #290 | Tragic $82,005 |
| Potawatomi | 0.1 /100 | #291 | Tragic $81,774 |
| Yaqui | 0.1 /100 | #292 | Tragic $81,656 |
| Blackfeet | 0.1 /100 | #293 | Tragic $81,531 |
| Cubans | 0.1 /100 | #294 | Tragic $81,483 |
| Bangladeshis | 0.1 /100 | #295 | Tragic $81,363 |
| Immigrants | Dominica | 0.1 /100 | #296 | Tragic $81,351 |
| Immigrants | Guatemala | 0.1 /100 | #297 | Tragic $81,341 |
| Dominicans | 0.1 /100 | #298 | Tragic $81,229 |
| Immigrants | Liberia | 0.1 /100 | #299 | Tragic $80,863 |
| Cherokee | 0.0 /100 | #300 | Tragic $80,843 |
| Immigrants | Micronesia | 0.0 /100 | #301 | Tragic $80,544 |
| Hispanics or Latinos | 0.0 /100 | #302 | Tragic $80,515 |