Immigrants from Romania vs Chinese Householder Income Ages 25 - 44 years
COMPARE
Immigrants from Romania
Chinese
Householder Income Ages 25 - 44 years
Householder Income Ages 25 - 44 years Comparison
Immigrants from Romania
Chinese
$104,713
HOUSEHOLDER INCOME AGES 25 - 44 YEARS
99.6/ 100
METRIC RATING
67th/ 347
METRIC RANK
$104,264
HOUSEHOLDER INCOME AGES 25 - 44 YEARS
99.5/ 100
METRIC RATING
72nd/ 347
METRIC RANK
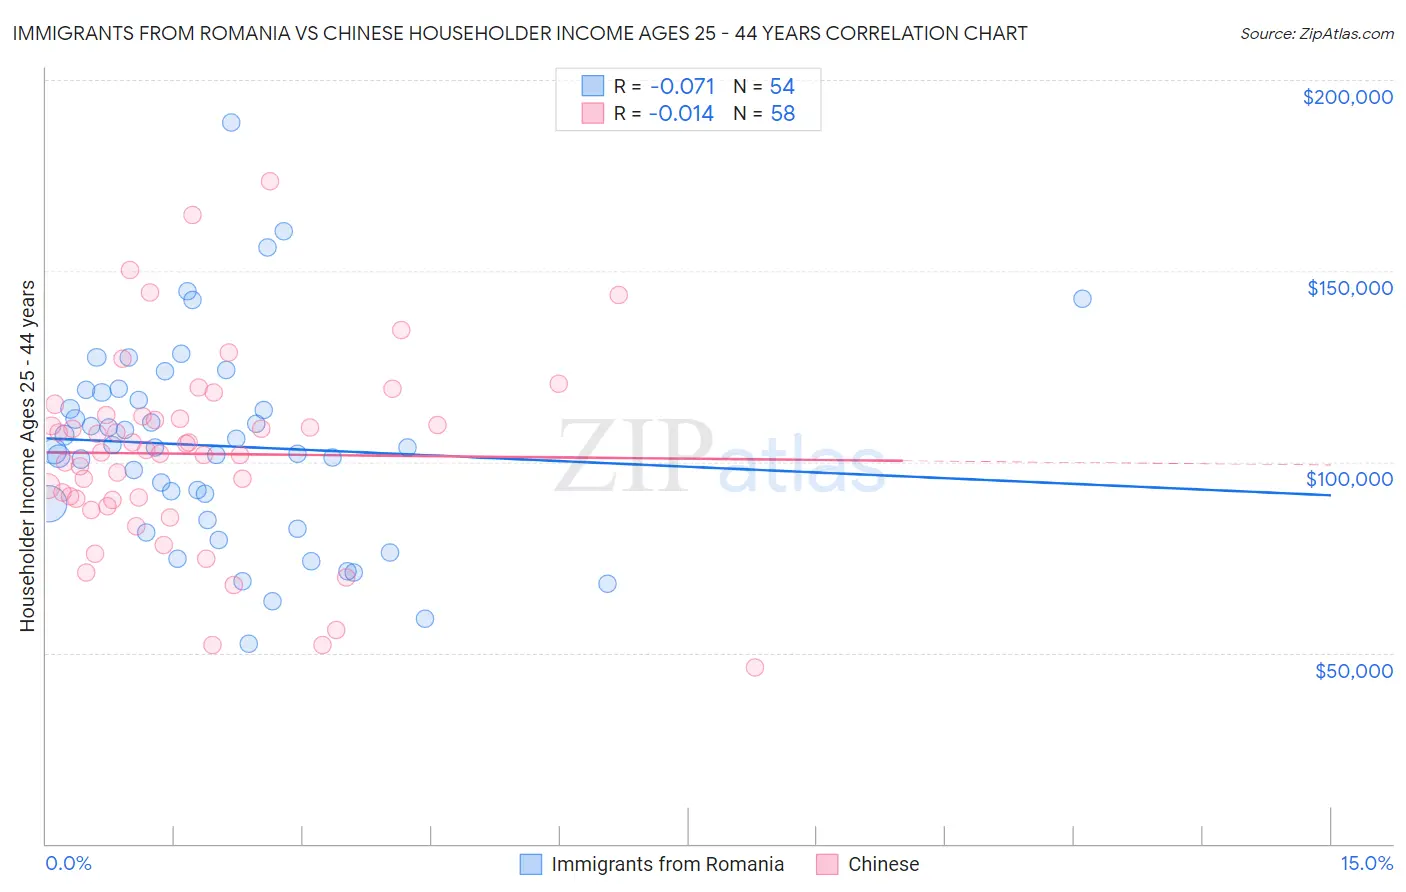
Immigrants from Romania vs Chinese Householder Income Ages 25 - 44 years Correlation Chart
The statistical analysis conducted on geographies consisting of 256,633,745 people shows a slight negative correlation between the proportion of Immigrants from Romania and household income with householder between the ages 25 and 44 in the United States with a correlation coefficient (R) of -0.071 and weighted average of $104,713. Similarly, the statistical analysis conducted on geographies consisting of 64,779,032 people shows no correlation between the proportion of Chinese and household income with householder between the ages 25 and 44 in the United States with a correlation coefficient (R) of -0.014 and weighted average of $104,264, a difference of 0.43%.
Householder Income Ages 25 - 44 years Correlation Summary
| Measurement | Immigrants from Romania | Chinese |
| Minimum | $52,260 | $46,250 |
| Maximum | $188,943 | $173,338 |
| Range | $136,683 | $127,088 |
| Mean | $104,157 | $102,110 |
| Median | $103,726 | $102,775 |
| Interquartile 25% (IQ1) | $84,716 | $90,138 |
| Interquartile 75% (IQ3) | $118,244 | $111,997 |
| Interquartile Range (IQR) | $33,528 | $21,859 |
| Standard Deviation (Sample) | $26,678 | $25,334 |
| Standard Deviation (Population) | $26,430 | $25,115 |
Demographics Similar to Immigrants from Romania and Chinese by Householder Income Ages 25 - 44 years
In terms of householder income ages 25 - 44 years, the demographic groups most similar to Immigrants from Romania are Immigrants from Eastern Europe ($104,662, a difference of 0.050%), Mongolian ($104,578, a difference of 0.13%), Immigrants from Croatia ($104,503, a difference of 0.20%), Laotian ($104,993, a difference of 0.27%), and Afghan ($104,410, a difference of 0.29%). Similarly, the demographic groups most similar to Chinese are Italian ($104,215, a difference of 0.050%), Afghan ($104,410, a difference of 0.14%), Immigrants from Croatia ($104,503, a difference of 0.23%), Mongolian ($104,578, a difference of 0.30%), and Immigrants from Fiji ($103,954, a difference of 0.30%).
| Demographics | Rating | Rank | Householder Income Ages 25 - 44 years |
| Immigrants | Latvia | 99.8 /100 | #59 | Exceptional $105,522 |
| Egyptians | 99.7 /100 | #60 | Exceptional $105,282 |
| Lithuanians | 99.7 /100 | #61 | Exceptional $105,223 |
| Immigrants | Italy | 99.7 /100 | #62 | Exceptional $105,201 |
| Immigrants | Scotland | 99.7 /100 | #63 | Exceptional $105,089 |
| New Zealanders | 99.7 /100 | #64 | Exceptional $105,085 |
| Immigrants | Netherlands | 99.7 /100 | #65 | Exceptional $105,082 |
| Laotians | 99.7 /100 | #66 | Exceptional $104,993 |
| Immigrants | Romania | 99.6 /100 | #67 | Exceptional $104,713 |
| Immigrants | Eastern Europe | 99.6 /100 | #68 | Exceptional $104,662 |
| Mongolians | 99.6 /100 | #69 | Exceptional $104,578 |
| Immigrants | Croatia | 99.6 /100 | #70 | Exceptional $104,503 |
| Afghans | 99.6 /100 | #71 | Exceptional $104,410 |
| Chinese | 99.5 /100 | #72 | Exceptional $104,264 |
| Italians | 99.5 /100 | #73 | Exceptional $104,215 |
| Immigrants | Fiji | 99.5 /100 | #74 | Exceptional $103,954 |
| Koreans | 99.4 /100 | #75 | Exceptional $103,824 |
| Immigrants | Spain | 99.4 /100 | #76 | Exceptional $103,752 |
| Immigrants | Southern Europe | 99.3 /100 | #77 | Exceptional $103,486 |
| Immigrants | Bulgaria | 99.3 /100 | #78 | Exceptional $103,423 |
| Armenians | 99.2 /100 | #79 | Exceptional $103,248 |