Immigrants from Pakistan vs Slovene Median Female Earnings
COMPARE
Immigrants from Pakistan
Slovene
Median Female Earnings
Median Female Earnings Comparison
Immigrants from Pakistan
Slovenes
$43,052
MEDIAN FEMALE EARNINGS
99.9/ 100
METRIC RATING
64th/ 347
METRIC RANK
$39,817
MEDIAN FEMALE EARNINGS
56.2/ 100
METRIC RATING
170th/ 347
METRIC RANK
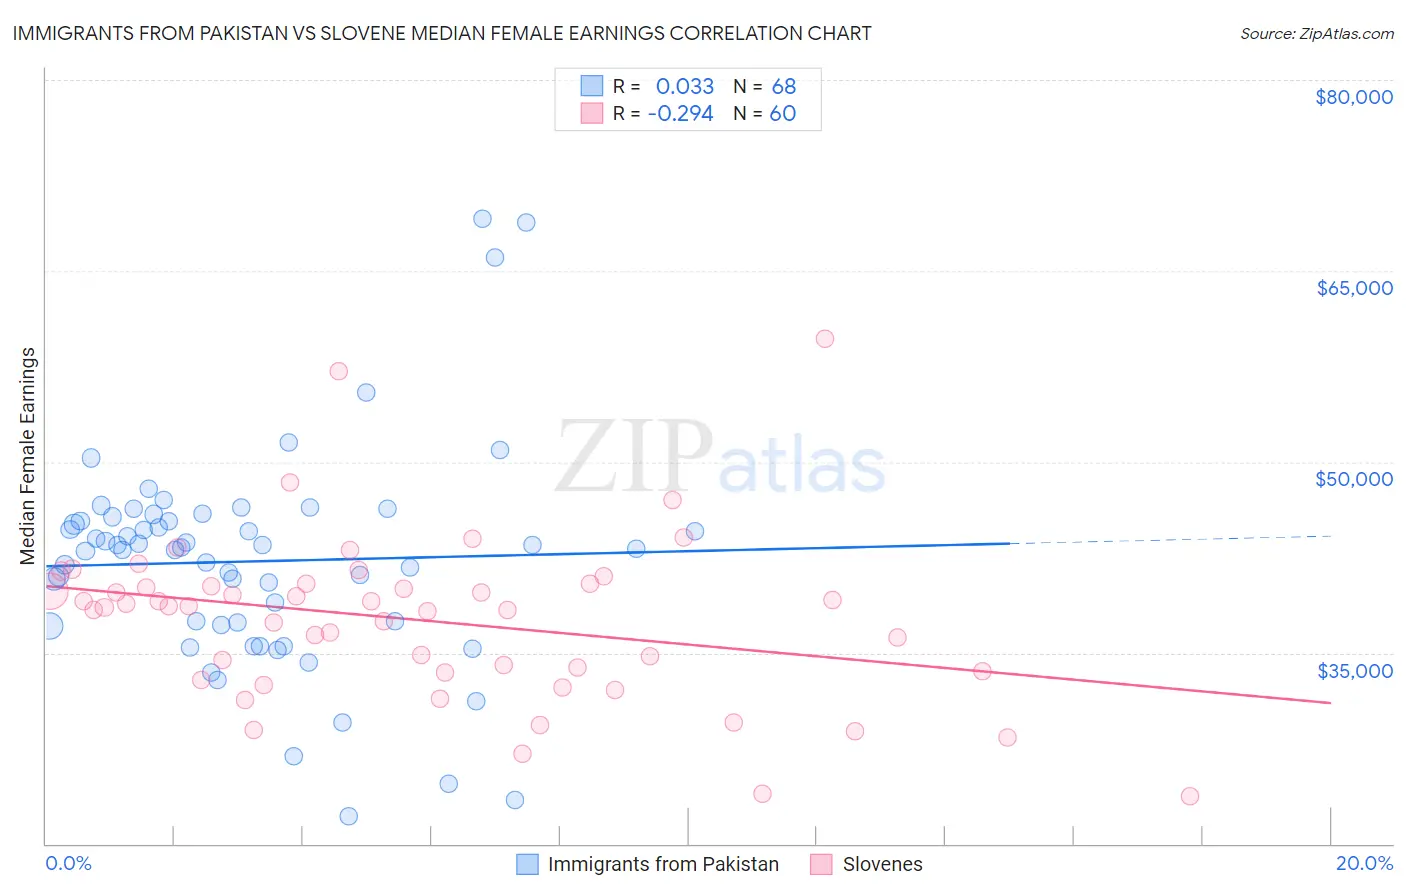
Immigrants from Pakistan vs Slovene Median Female Earnings Correlation Chart
The statistical analysis conducted on geographies consisting of 283,887,032 people shows no correlation between the proportion of Immigrants from Pakistan and median female earnings in the United States with a correlation coefficient (R) of 0.033 and weighted average of $43,052. Similarly, the statistical analysis conducted on geographies consisting of 261,275,001 people shows a weak negative correlation between the proportion of Slovenes and median female earnings in the United States with a correlation coefficient (R) of -0.294 and weighted average of $39,817, a difference of 8.1%.
Median Female Earnings Correlation Summary
| Measurement | Immigrants from Pakistan | Slovene |
| Minimum | $22,138 | $23,750 |
| Maximum | $69,138 | $59,643 |
| Range | $47,000 | $35,893 |
| Mean | $42,182 | $37,579 |
| Median | $43,220 | $38,639 |
| Interquartile 25% (IQ1) | $37,265 | $33,473 |
| Interquartile 75% (IQ3) | $45,503 | $40,326 |
| Interquartile Range (IQR) | $8,238 | $6,853 |
| Standard Deviation (Sample) | $8,546 | $6,516 |
| Standard Deviation (Population) | $8,483 | $6,461 |
Similar Demographics by Median Female Earnings
Demographics Similar to Immigrants from Pakistan by Median Female Earnings
In terms of median female earnings, the demographic groups most similar to Immigrants from Pakistan are Immigrants from Ukraine ($43,069, a difference of 0.040%), Afghan ($43,077, a difference of 0.060%), Immigrants from Bulgaria ($43,085, a difference of 0.080%), Immigrants from Latvia ($43,099, a difference of 0.11%), and Estonian ($43,106, a difference of 0.12%).
| Demographics | Rating | Rank | Median Female Earnings |
| Ethiopians | 99.9 /100 | #57 | Exceptional $43,243 |
| Paraguayans | 99.9 /100 | #58 | Exceptional $43,173 |
| Estonians | 99.9 /100 | #59 | Exceptional $43,106 |
| Immigrants | Latvia | 99.9 /100 | #60 | Exceptional $43,099 |
| Immigrants | Bulgaria | 99.9 /100 | #61 | Exceptional $43,085 |
| Afghans | 99.9 /100 | #62 | Exceptional $43,077 |
| Immigrants | Ukraine | 99.9 /100 | #63 | Exceptional $43,069 |
| Immigrants | Pakistan | 99.9 /100 | #64 | Exceptional $43,052 |
| Sierra Leoneans | 99.9 /100 | #65 | Exceptional $42,868 |
| Immigrants | Norway | 99.9 /100 | #66 | Exceptional $42,837 |
| Immigrants | Egypt | 99.9 /100 | #67 | Exceptional $42,837 |
| Immigrants | Austria | 99.8 /100 | #68 | Exceptional $42,824 |
| Immigrants | Spain | 99.8 /100 | #69 | Exceptional $42,815 |
| Immigrants | Ethiopia | 99.8 /100 | #70 | Exceptional $42,744 |
| Immigrants | Romania | 99.8 /100 | #71 | Exceptional $42,718 |
Demographics Similar to Slovenes by Median Female Earnings
In terms of median female earnings, the demographic groups most similar to Slovenes are Immigrants from Portugal ($39,788, a difference of 0.070%), Kenyan ($39,860, a difference of 0.11%), British ($39,772, a difference of 0.11%), Immigrants from Peru ($39,871, a difference of 0.13%), and Immigrants from Ghana ($39,894, a difference of 0.19%).
| Demographics | Rating | Rank | Median Female Earnings |
| Lebanese | 65.5 /100 | #163 | Good $40,006 |
| Immigrants | Saudi Arabia | 62.9 /100 | #164 | Good $39,952 |
| Immigrants | Bangladesh | 60.8 /100 | #165 | Good $39,910 |
| Immigrants | Ghana | 60.0 /100 | #166 | Good $39,894 |
| Luxembourgers | 59.9 /100 | #167 | Average $39,891 |
| Immigrants | Peru | 58.9 /100 | #168 | Average $39,871 |
| Kenyans | 58.4 /100 | #169 | Average $39,860 |
| Slovenes | 56.2 /100 | #170 | Average $39,817 |
| Immigrants | Portugal | 54.7 /100 | #171 | Average $39,788 |
| British | 53.8 /100 | #172 | Average $39,772 |
| Canadians | 51.4 /100 | #173 | Average $39,724 |
| South Americans | 50.0 /100 | #174 | Average $39,698 |
| Immigrants | South America | 47.2 /100 | #175 | Average $39,643 |
| Nigerians | 47.0 /100 | #176 | Average $39,641 |
| Costa Ricans | 46.1 /100 | #177 | Average $39,622 |