Immigrants from Pakistan vs Immigrants from Latin America Median Female Earnings
COMPARE
Immigrants from Pakistan
Immigrants from Latin America
Median Female Earnings
Median Female Earnings Comparison
Immigrants from Pakistan
Immigrants from Latin America
$43,052
MEDIAN FEMALE EARNINGS
99.9/ 100
METRIC RATING
64th/ 347
METRIC RANK
$35,307
MEDIAN FEMALE EARNINGS
0.0/ 100
METRIC RATING
303rd/ 347
METRIC RANK
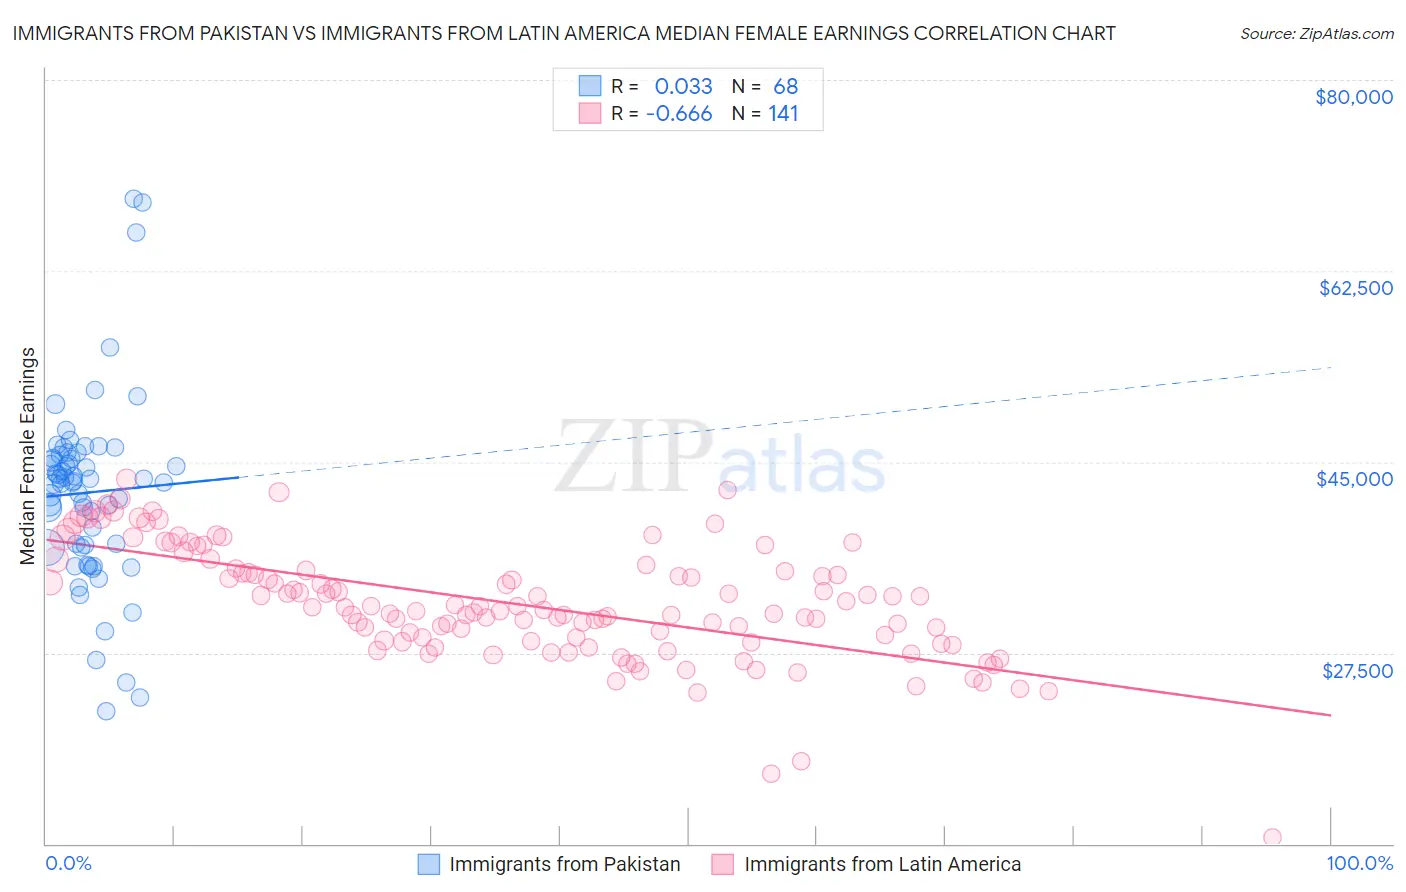
Immigrants from Pakistan vs Immigrants from Latin America Median Female Earnings Correlation Chart
The statistical analysis conducted on geographies consisting of 283,887,032 people shows no correlation between the proportion of Immigrants from Pakistan and median female earnings in the United States with a correlation coefficient (R) of 0.033 and weighted average of $43,052. Similarly, the statistical analysis conducted on geographies consisting of 557,242,268 people shows a significant negative correlation between the proportion of Immigrants from Latin America and median female earnings in the United States with a correlation coefficient (R) of -0.666 and weighted average of $35,307, a difference of 21.9%.
Median Female Earnings Correlation Summary
| Measurement | Immigrants from Pakistan | Immigrants from Latin America |
| Minimum | $22,138 | $10,532 |
| Maximum | $69,138 | $43,408 |
| Range | $47,000 | $32,876 |
| Mean | $42,182 | $32,057 |
| Median | $43,220 | $31,685 |
| Interquartile 25% (IQ1) | $37,265 | $28,590 |
| Interquartile 75% (IQ3) | $45,503 | $35,130 |
| Interquartile Range (IQR) | $8,238 | $6,540 |
| Standard Deviation (Sample) | $8,546 | $5,280 |
| Standard Deviation (Population) | $8,483 | $5,261 |
Similar Demographics by Median Female Earnings
Demographics Similar to Immigrants from Pakistan by Median Female Earnings
In terms of median female earnings, the demographic groups most similar to Immigrants from Pakistan are Immigrants from Ukraine ($43,069, a difference of 0.040%), Afghan ($43,077, a difference of 0.060%), Immigrants from Bulgaria ($43,085, a difference of 0.080%), Immigrants from Latvia ($43,099, a difference of 0.11%), and Estonian ($43,106, a difference of 0.12%).
| Demographics | Rating | Rank | Median Female Earnings |
| Ethiopians | 99.9 /100 | #57 | Exceptional $43,243 |
| Paraguayans | 99.9 /100 | #58 | Exceptional $43,173 |
| Estonians | 99.9 /100 | #59 | Exceptional $43,106 |
| Immigrants | Latvia | 99.9 /100 | #60 | Exceptional $43,099 |
| Immigrants | Bulgaria | 99.9 /100 | #61 | Exceptional $43,085 |
| Afghans | 99.9 /100 | #62 | Exceptional $43,077 |
| Immigrants | Ukraine | 99.9 /100 | #63 | Exceptional $43,069 |
| Immigrants | Pakistan | 99.9 /100 | #64 | Exceptional $43,052 |
| Sierra Leoneans | 99.9 /100 | #65 | Exceptional $42,868 |
| Immigrants | Norway | 99.9 /100 | #66 | Exceptional $42,837 |
| Immigrants | Egypt | 99.9 /100 | #67 | Exceptional $42,837 |
| Immigrants | Austria | 99.8 /100 | #68 | Exceptional $42,824 |
| Immigrants | Spain | 99.8 /100 | #69 | Exceptional $42,815 |
| Immigrants | Ethiopia | 99.8 /100 | #70 | Exceptional $42,744 |
| Immigrants | Romania | 99.8 /100 | #71 | Exceptional $42,718 |
Demographics Similar to Immigrants from Latin America by Median Female Earnings
In terms of median female earnings, the demographic groups most similar to Immigrants from Latin America are Black/African American ($35,315, a difference of 0.020%), Pima ($35,326, a difference of 0.050%), Crow ($35,266, a difference of 0.11%), Yuman ($35,377, a difference of 0.20%), and Immigrants from Guatemala ($35,444, a difference of 0.39%).
| Demographics | Rating | Rank | Median Female Earnings |
| Mexican American Indians | 0.0 /100 | #296 | Tragic $35,629 |
| Hmong | 0.0 /100 | #297 | Tragic $35,498 |
| Immigrants | Micronesia | 0.0 /100 | #298 | Tragic $35,477 |
| Immigrants | Guatemala | 0.0 /100 | #299 | Tragic $35,444 |
| Yuman | 0.0 /100 | #300 | Tragic $35,377 |
| Pima | 0.0 /100 | #301 | Tragic $35,326 |
| Blacks/African Americans | 0.0 /100 | #302 | Tragic $35,315 |
| Immigrants | Latin America | 0.0 /100 | #303 | Tragic $35,307 |
| Crow | 0.0 /100 | #304 | Tragic $35,266 |
| Bahamians | 0.0 /100 | #305 | Tragic $35,125 |
| Fijians | 0.0 /100 | #306 | Tragic $35,114 |
| Sioux | 0.0 /100 | #307 | Tragic $35,063 |
| Immigrants | Bahamas | 0.0 /100 | #308 | Tragic $35,027 |
| Hondurans | 0.0 /100 | #309 | Tragic $35,013 |
| Chippewa | 0.0 /100 | #310 | Tragic $35,003 |