Immigrants from Norway vs American Median Earnings
COMPARE
Immigrants from Norway
American
Median Earnings
Median Earnings Comparison
Immigrants from Norway
Americans
$51,758
MEDIAN EARNINGS
99.9/ 100
METRIC RATING
53rd/ 347
METRIC RANK
$42,742
MEDIAN EARNINGS
0.6/ 100
METRIC RATING
268th/ 347
METRIC RANK
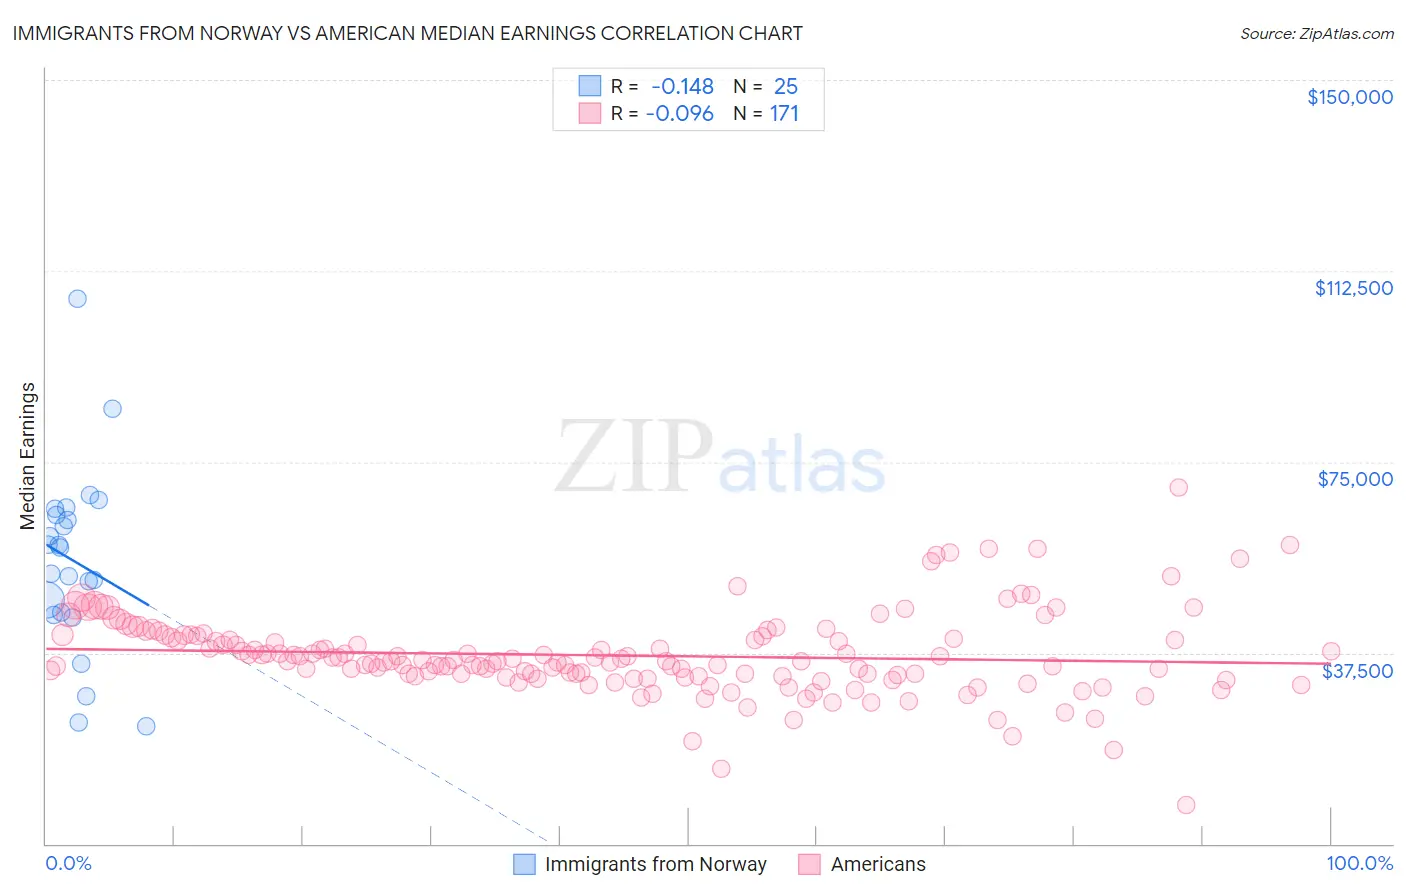
Immigrants from Norway vs American Median Earnings Correlation Chart
The statistical analysis conducted on geographies consisting of 116,707,889 people shows a poor negative correlation between the proportion of Immigrants from Norway and median earnings in the United States with a correlation coefficient (R) of -0.148 and weighted average of $51,758. Similarly, the statistical analysis conducted on geographies consisting of 581,345,964 people shows a slight negative correlation between the proportion of Americans and median earnings in the United States with a correlation coefficient (R) of -0.096 and weighted average of $42,742, a difference of 21.1%.
Median Earnings Correlation Summary
| Measurement | Immigrants from Norway | American |
| Minimum | $23,125 | $7,598 |
| Maximum | $106,979 | $70,000 |
| Range | $83,854 | $62,402 |
| Mean | $55,577 | $36,993 |
| Median | $58,159 | $35,919 |
| Interquartile 25% (IQ1) | $45,162 | $32,980 |
| Interquartile 75% (IQ3) | $65,163 | $40,815 |
| Interquartile Range (IQR) | $20,000 | $7,835 |
| Standard Deviation (Sample) | $18,163 | $8,064 |
| Standard Deviation (Population) | $17,796 | $8,040 |
Similar Demographics by Median Earnings
Demographics Similar to Immigrants from Norway by Median Earnings
In terms of median earnings, the demographic groups most similar to Immigrants from Norway are Estonian ($51,772, a difference of 0.030%), Immigrants from Indonesia ($51,715, a difference of 0.080%), Egyptian ($51,701, a difference of 0.11%), Immigrants from Austria ($51,826, a difference of 0.13%), and Immigrants from Pakistan ($51,693, a difference of 0.13%).
| Demographics | Rating | Rank | Median Earnings |
| Bhutanese | 100.0 /100 | #46 | Exceptional $52,297 |
| Australians | 100.0 /100 | #47 | Exceptional $52,294 |
| Immigrants | Europe | 100.0 /100 | #48 | Exceptional $52,195 |
| Bolivians | 100.0 /100 | #49 | Exceptional $52,005 |
| Immigrants | South Africa | 100.0 /100 | #50 | Exceptional $51,850 |
| Immigrants | Austria | 99.9 /100 | #51 | Exceptional $51,826 |
| Estonians | 99.9 /100 | #52 | Exceptional $51,772 |
| Immigrants | Norway | 99.9 /100 | #53 | Exceptional $51,758 |
| Immigrants | Indonesia | 99.9 /100 | #54 | Exceptional $51,715 |
| Egyptians | 99.9 /100 | #55 | Exceptional $51,701 |
| Immigrants | Pakistan | 99.9 /100 | #56 | Exceptional $51,693 |
| Immigrants | Eastern Europe | 99.9 /100 | #57 | Exceptional $51,624 |
| Immigrants | Bolivia | 99.9 /100 | #58 | Exceptional $51,605 |
| Immigrants | Croatia | 99.9 /100 | #59 | Exceptional $51,581 |
| Immigrants | Serbia | 99.9 /100 | #60 | Exceptional $51,557 |
Demographics Similar to Americans by Median Earnings
In terms of median earnings, the demographic groups most similar to Americans are Cree ($42,777, a difference of 0.080%), Belizean ($42,702, a difference of 0.090%), Osage ($42,651, a difference of 0.21%), Pennsylvania German ($42,615, a difference of 0.30%), and Immigrants from Laos ($42,884, a difference of 0.33%).
| Demographics | Rating | Rank | Median Earnings |
| Immigrants | Jamaica | 0.8 /100 | #261 | Tragic $43,026 |
| Nicaraguans | 0.8 /100 | #262 | Tragic $43,026 |
| Inupiat | 0.8 /100 | #263 | Tragic $43,000 |
| Immigrants | Liberia | 0.7 /100 | #264 | Tragic $42,923 |
| Salvadorans | 0.7 /100 | #265 | Tragic $42,912 |
| Immigrants | Laos | 0.7 /100 | #266 | Tragic $42,884 |
| Cree | 0.6 /100 | #267 | Tragic $42,777 |
| Americans | 0.6 /100 | #268 | Tragic $42,742 |
| Belizeans | 0.5 /100 | #269 | Tragic $42,702 |
| Osage | 0.5 /100 | #270 | Tragic $42,651 |
| Pennsylvania Germans | 0.5 /100 | #271 | Tragic $42,615 |
| Iroquois | 0.4 /100 | #272 | Tragic $42,430 |
| Immigrants | Dominica | 0.4 /100 | #273 | Tragic $42,420 |
| Immigrants | El Salvador | 0.4 /100 | #274 | Tragic $42,413 |
| Immigrants | Belize | 0.3 /100 | #275 | Tragic $42,339 |