Immigrants from Norway vs Moroccan Householder Income Over 65 years
COMPARE
Immigrants from Norway
Moroccan
Householder Income Over 65 years
Householder Income Over 65 years Comparison
Immigrants from Norway
Moroccans
$66,118
HOUSEHOLDER INCOME OVER 65 YEARS
99.5/ 100
METRIC RATING
59th/ 347
METRIC RANK
$59,683
HOUSEHOLDER INCOME OVER 65 YEARS
20.7/ 100
METRIC RATING
198th/ 347
METRIC RANK
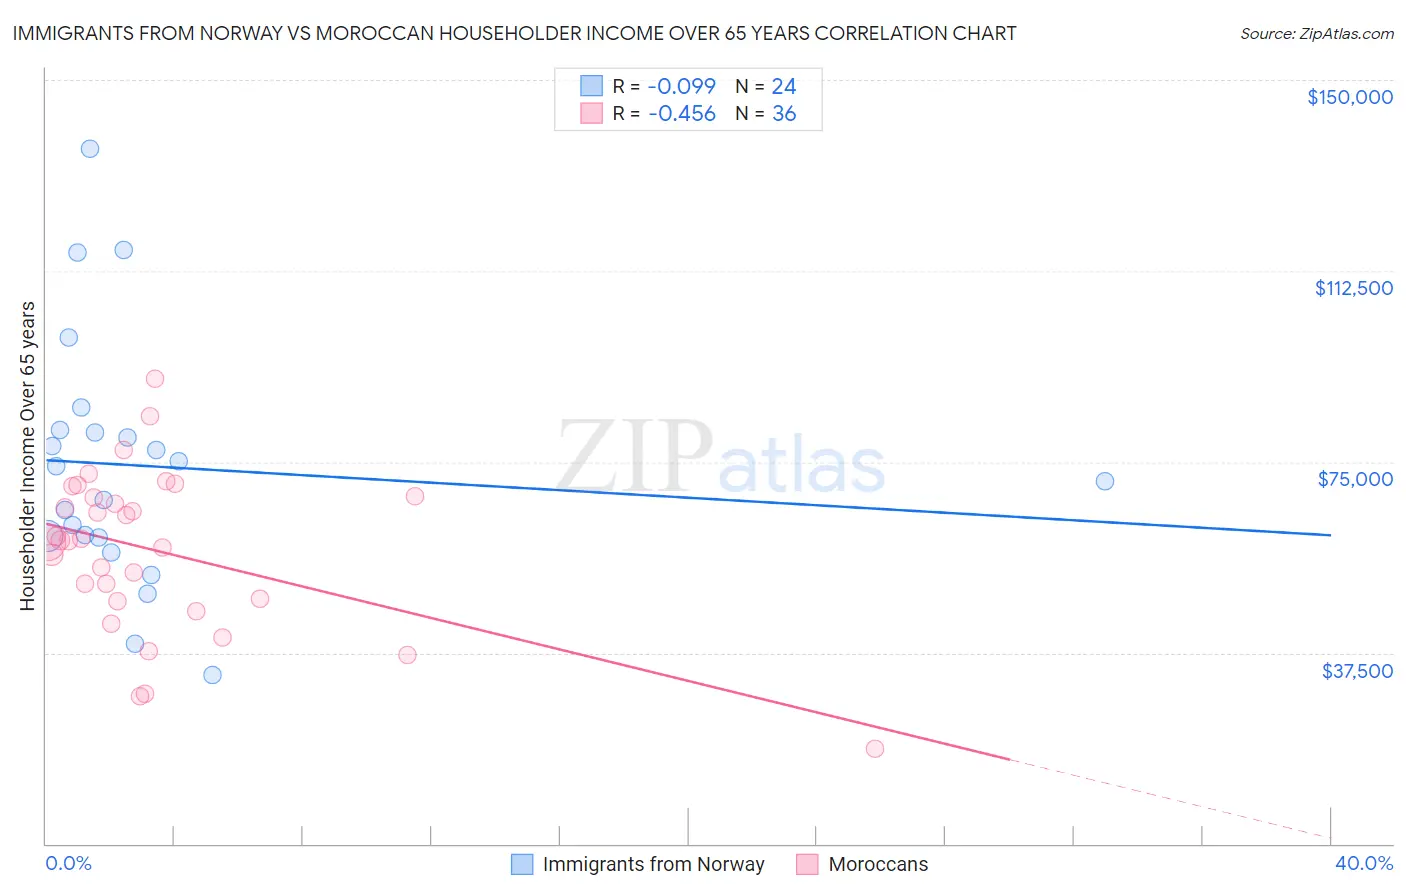
Immigrants from Norway vs Moroccan Householder Income Over 65 years Correlation Chart
The statistical analysis conducted on geographies consisting of 116,634,171 people shows a slight negative correlation between the proportion of Immigrants from Norway and household income with householder over the age of 65 in the United States with a correlation coefficient (R) of -0.099 and weighted average of $66,118. Similarly, the statistical analysis conducted on geographies consisting of 201,528,481 people shows a moderate negative correlation between the proportion of Moroccans and household income with householder over the age of 65 in the United States with a correlation coefficient (R) of -0.456 and weighted average of $59,683, a difference of 10.8%.
Householder Income Over 65 years Correlation Summary
| Measurement | Immigrants from Norway | Moroccan |
| Minimum | $33,063 | $18,625 |
| Maximum | $136,596 | $91,360 |
| Range | $103,533 | $72,735 |
| Mean | $74,203 | $57,561 |
| Median | $72,656 | $59,547 |
| Interquartile 25% (IQ1) | $60,289 | $47,767 |
| Interquartile 75% (IQ3) | $81,117 | $68,126 |
| Interquartile Range (IQR) | $20,828 | $20,359 |
| Standard Deviation (Sample) | $24,233 | $15,674 |
| Standard Deviation (Population) | $23,722 | $15,455 |
Similar Demographics by Householder Income Over 65 years
Demographics Similar to Immigrants from Norway by Householder Income Over 65 years
In terms of householder income over 65 years, the demographic groups most similar to Immigrants from Norway are Immigrants from Lithuania ($66,087, a difference of 0.050%), Immigrants from Philippines ($66,161, a difference of 0.060%), Maltese ($66,027, a difference of 0.14%), Immigrants from Sierra Leone ($66,009, a difference of 0.17%), and Bulgarian ($66,236, a difference of 0.18%).
| Demographics | Rating | Rank | Householder Income Over 65 years |
| Immigrants | Scotland | 99.7 /100 | #52 | Exceptional $66,620 |
| Immigrants | Pakistan | 99.7 /100 | #53 | Exceptional $66,617 |
| Immigrants | Netherlands | 99.7 /100 | #54 | Exceptional $66,463 |
| Immigrants | Czechoslovakia | 99.7 /100 | #55 | Exceptional $66,376 |
| Laotians | 99.6 /100 | #56 | Exceptional $66,306 |
| Bulgarians | 99.6 /100 | #57 | Exceptional $66,236 |
| Immigrants | Philippines | 99.6 /100 | #58 | Exceptional $66,161 |
| Immigrants | Norway | 99.5 /100 | #59 | Exceptional $66,118 |
| Immigrants | Lithuania | 99.5 /100 | #60 | Exceptional $66,087 |
| Maltese | 99.5 /100 | #61 | Exceptional $66,027 |
| Immigrants | Sierra Leone | 99.5 /100 | #62 | Exceptional $66,009 |
| Marshallese | 99.4 /100 | #63 | Exceptional $65,874 |
| Zimbabweans | 99.4 /100 | #64 | Exceptional $65,854 |
| Immigrants | England | 99.3 /100 | #65 | Exceptional $65,715 |
| South Africans | 99.3 /100 | #66 | Exceptional $65,652 |
Demographics Similar to Moroccans by Householder Income Over 65 years
In terms of householder income over 65 years, the demographic groups most similar to Moroccans are Immigrants from Kenya ($59,710, a difference of 0.040%), Immigrants ($59,656, a difference of 0.050%), French ($59,656, a difference of 0.050%), German ($59,730, a difference of 0.080%), and Immigrants from Iraq ($59,824, a difference of 0.24%).
| Demographics | Rating | Rank | Householder Income Over 65 years |
| Belgians | 24.9 /100 | #191 | Fair $59,915 |
| South Americans | 23.8 /100 | #192 | Fair $59,854 |
| Immigrants | Costa Rica | 23.6 /100 | #193 | Fair $59,848 |
| Immigrants | Africa | 23.4 /100 | #194 | Fair $59,837 |
| Immigrants | Iraq | 23.2 /100 | #195 | Fair $59,824 |
| Germans | 21.5 /100 | #196 | Fair $59,730 |
| Immigrants | Kenya | 21.1 /100 | #197 | Fair $59,710 |
| Moroccans | 20.7 /100 | #198 | Fair $59,683 |
| Immigrants | Immigrants | 20.2 /100 | #199 | Fair $59,656 |
| French | 20.2 /100 | #200 | Fair $59,656 |
| Dutch | 18.3 /100 | #201 | Poor $59,539 |
| Finns | 18.2 /100 | #202 | Poor $59,535 |
| Scotch-Irish | 16.9 /100 | #203 | Poor $59,447 |
| Arapaho | 16.0 /100 | #204 | Poor $59,383 |
| Immigrants | Sudan | 14.2 /100 | #205 | Poor $59,248 |