Dutch vs Moroccan Householder Income Over 65 years
COMPARE
Dutch
Moroccan
Householder Income Over 65 years
Householder Income Over 65 years Comparison
Dutch
Moroccans
$59,539
HOUSEHOLDER INCOME OVER 65 YEARS
18.3/ 100
METRIC RATING
201st/ 347
METRIC RANK
$59,683
HOUSEHOLDER INCOME OVER 65 YEARS
20.7/ 100
METRIC RATING
198th/ 347
METRIC RANK
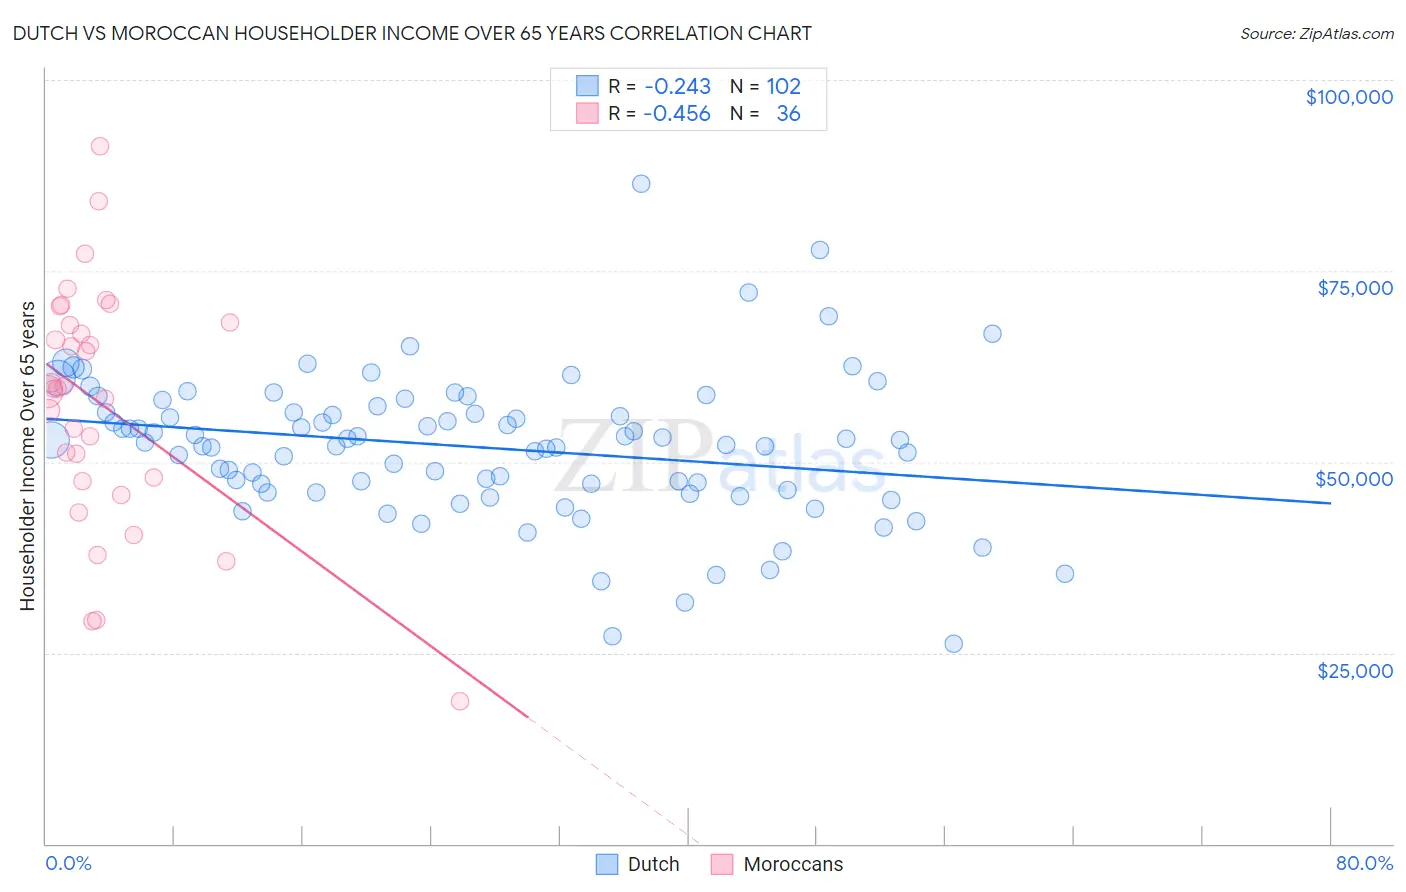
Dutch vs Moroccan Householder Income Over 65 years Correlation Chart
The statistical analysis conducted on geographies consisting of 550,167,438 people shows a weak negative correlation between the proportion of Dutch and household income with householder over the age of 65 in the United States with a correlation coefficient (R) of -0.243 and weighted average of $59,539. Similarly, the statistical analysis conducted on geographies consisting of 201,528,481 people shows a moderate negative correlation between the proportion of Moroccans and household income with householder over the age of 65 in the United States with a correlation coefficient (R) of -0.456 and weighted average of $59,683, a difference of 0.24%.
Householder Income Over 65 years Correlation Summary
| Measurement | Dutch | Moroccan |
| Minimum | $26,250 | $18,625 |
| Maximum | $86,382 | $91,360 |
| Range | $60,132 | $72,735 |
| Mean | $51,927 | $57,561 |
| Median | $52,693 | $59,547 |
| Interquartile 25% (IQ1) | $46,259 | $47,767 |
| Interquartile 75% (IQ3) | $56,502 | $68,126 |
| Interquartile Range (IQR) | $10,242 | $20,359 |
| Standard Deviation (Sample) | $9,453 | $15,674 |
| Standard Deviation (Population) | $9,406 | $15,455 |
Demographics Similar to Dutch and Moroccans by Householder Income Over 65 years
In terms of householder income over 65 years, the demographic groups most similar to Dutch are Finnish ($59,535, a difference of 0.010%), Scotch-Irish ($59,447, a difference of 0.15%), Immigrants ($59,656, a difference of 0.20%), French ($59,656, a difference of 0.20%), and Arapaho ($59,383, a difference of 0.26%). Similarly, the demographic groups most similar to Moroccans are Immigrants from Kenya ($59,710, a difference of 0.040%), Immigrants ($59,656, a difference of 0.050%), French ($59,656, a difference of 0.050%), German ($59,730, a difference of 0.080%), and Immigrants from Iraq ($59,824, a difference of 0.24%).
| Demographics | Rating | Rank | Householder Income Over 65 years |
| Ghanaians | 27.5 /100 | #189 | Fair $60,043 |
| Puget Sound Salish | 25.3 /100 | #190 | Fair $59,934 |
| Belgians | 24.9 /100 | #191 | Fair $59,915 |
| South Americans | 23.8 /100 | #192 | Fair $59,854 |
| Immigrants | Costa Rica | 23.6 /100 | #193 | Fair $59,848 |
| Immigrants | Africa | 23.4 /100 | #194 | Fair $59,837 |
| Immigrants | Iraq | 23.2 /100 | #195 | Fair $59,824 |
| Germans | 21.5 /100 | #196 | Fair $59,730 |
| Immigrants | Kenya | 21.1 /100 | #197 | Fair $59,710 |
| Moroccans | 20.7 /100 | #198 | Fair $59,683 |
| Immigrants | Immigrants | 20.2 /100 | #199 | Fair $59,656 |
| French | 20.2 /100 | #200 | Fair $59,656 |
| Dutch | 18.3 /100 | #201 | Poor $59,539 |
| Finns | 18.2 /100 | #202 | Poor $59,535 |
| Scotch-Irish | 16.9 /100 | #203 | Poor $59,447 |
| Arapaho | 16.0 /100 | #204 | Poor $59,383 |
| Immigrants | Sudan | 14.2 /100 | #205 | Poor $59,248 |
| Immigrants | South America | 13.0 /100 | #206 | Poor $59,151 |
| Salvadorans | 12.9 /100 | #207 | Poor $59,141 |
| Uruguayans | 12.3 /100 | #208 | Poor $59,090 |
| Slovaks | 11.7 /100 | #209 | Poor $59,039 |