Honduran vs Moroccan Householder Income Over 65 years
COMPARE
Honduran
Moroccan
Householder Income Over 65 years
Householder Income Over 65 years Comparison
Hondurans
Moroccans
$52,634
HOUSEHOLDER INCOME OVER 65 YEARS
0.0/ 100
METRIC RATING
309th/ 347
METRIC RANK
$59,683
HOUSEHOLDER INCOME OVER 65 YEARS
20.7/ 100
METRIC RATING
198th/ 347
METRIC RANK
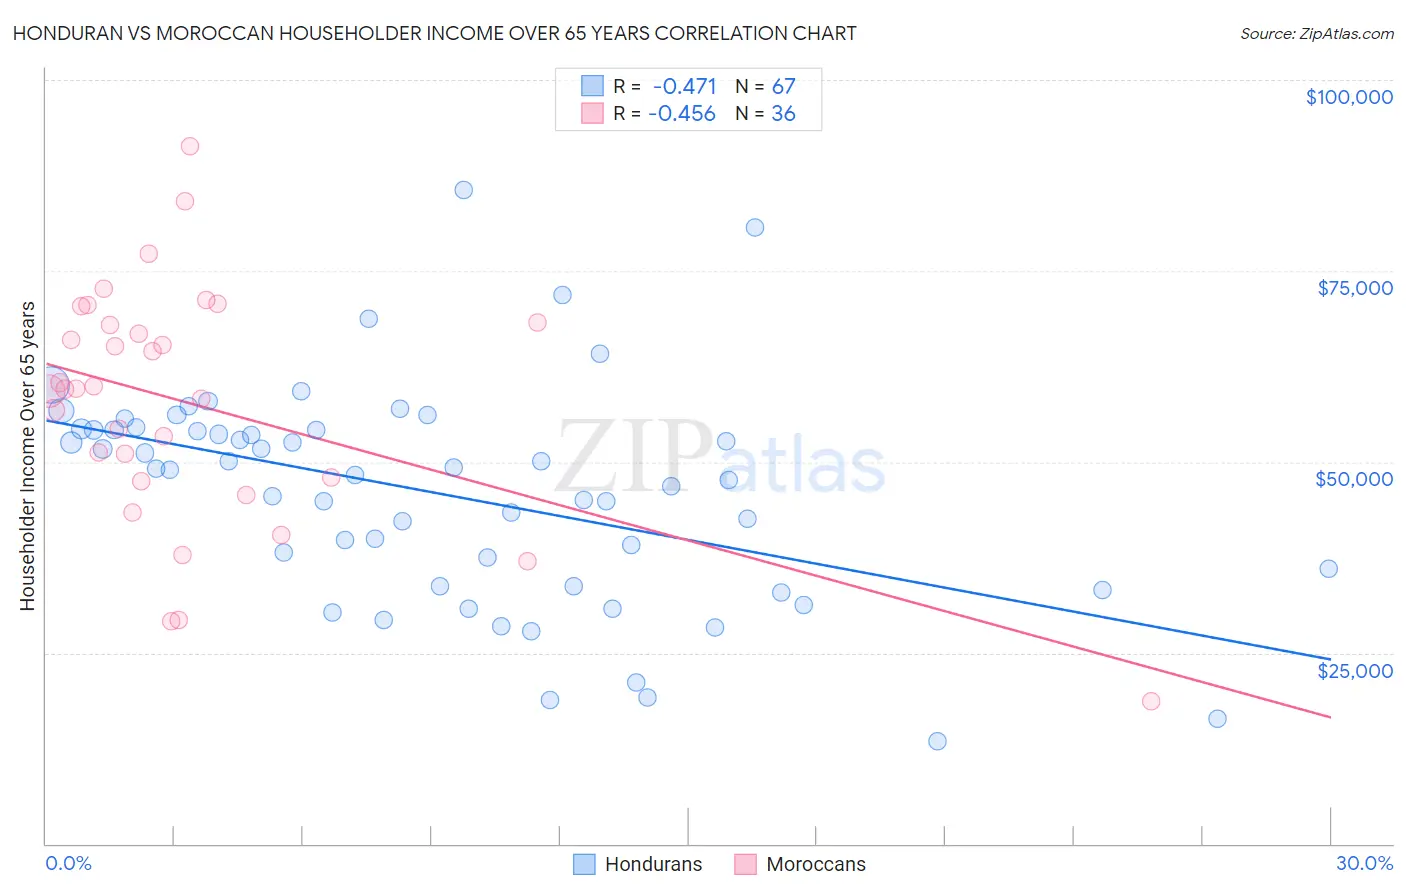
Honduran vs Moroccan Householder Income Over 65 years Correlation Chart
The statistical analysis conducted on geographies consisting of 356,652,935 people shows a moderate negative correlation between the proportion of Hondurans and household income with householder over the age of 65 in the United States with a correlation coefficient (R) of -0.471 and weighted average of $52,634. Similarly, the statistical analysis conducted on geographies consisting of 201,528,481 people shows a moderate negative correlation between the proportion of Moroccans and household income with householder over the age of 65 in the United States with a correlation coefficient (R) of -0.456 and weighted average of $59,683, a difference of 13.4%.
Householder Income Over 65 years Correlation Summary
| Measurement | Honduran | Moroccan |
| Minimum | $13,371 | $18,625 |
| Maximum | $85,625 | $91,360 |
| Range | $72,254 | $72,735 |
| Mean | $45,868 | $57,561 |
| Median | $48,924 | $59,547 |
| Interquartile 25% (IQ1) | $33,750 | $47,767 |
| Interquartile 75% (IQ3) | $54,223 | $68,126 |
| Interquartile Range (IQR) | $20,473 | $20,359 |
| Standard Deviation (Sample) | $14,320 | $15,674 |
| Standard Deviation (Population) | $14,213 | $15,455 |
Similar Demographics by Householder Income Over 65 years
Demographics Similar to Hondurans by Householder Income Over 65 years
In terms of householder income over 65 years, the demographic groups most similar to Hondurans are Sioux ($52,509, a difference of 0.24%), Immigrants from Mexico ($52,801, a difference of 0.32%), Hispanic or Latino ($52,832, a difference of 0.38%), Pennsylvania German ($52,888, a difference of 0.48%), and Seminole ($52,373, a difference of 0.50%).
| Demographics | Rating | Rank | Householder Income Over 65 years |
| Spanish American Indians | 0.0 /100 | #302 | Tragic $53,077 |
| Choctaw | 0.0 /100 | #303 | Tragic $53,060 |
| Ute | 0.0 /100 | #304 | Tragic $52,949 |
| Pueblo | 0.0 /100 | #305 | Tragic $52,930 |
| Pennsylvania Germans | 0.0 /100 | #306 | Tragic $52,888 |
| Hispanics or Latinos | 0.0 /100 | #307 | Tragic $52,832 |
| Immigrants | Mexico | 0.0 /100 | #308 | Tragic $52,801 |
| Hondurans | 0.0 /100 | #309 | Tragic $52,634 |
| Sioux | 0.0 /100 | #310 | Tragic $52,509 |
| Seminole | 0.0 /100 | #311 | Tragic $52,373 |
| Immigrants | Azores | 0.0 /100 | #312 | Tragic $52,121 |
| Immigrants | Nicaragua | 0.0 /100 | #313 | Tragic $52,085 |
| Natives/Alaskans | 0.0 /100 | #314 | Tragic $52,081 |
| U.S. Virgin Islanders | 0.0 /100 | #315 | Tragic $52,072 |
| Creek | 0.0 /100 | #316 | Tragic $51,949 |
Demographics Similar to Moroccans by Householder Income Over 65 years
In terms of householder income over 65 years, the demographic groups most similar to Moroccans are Immigrants from Kenya ($59,710, a difference of 0.040%), Immigrants ($59,656, a difference of 0.050%), French ($59,656, a difference of 0.050%), German ($59,730, a difference of 0.080%), and Immigrants from Iraq ($59,824, a difference of 0.24%).
| Demographics | Rating | Rank | Householder Income Over 65 years |
| Belgians | 24.9 /100 | #191 | Fair $59,915 |
| South Americans | 23.8 /100 | #192 | Fair $59,854 |
| Immigrants | Costa Rica | 23.6 /100 | #193 | Fair $59,848 |
| Immigrants | Africa | 23.4 /100 | #194 | Fair $59,837 |
| Immigrants | Iraq | 23.2 /100 | #195 | Fair $59,824 |
| Germans | 21.5 /100 | #196 | Fair $59,730 |
| Immigrants | Kenya | 21.1 /100 | #197 | Fair $59,710 |
| Moroccans | 20.7 /100 | #198 | Fair $59,683 |
| Immigrants | Immigrants | 20.2 /100 | #199 | Fair $59,656 |
| French | 20.2 /100 | #200 | Fair $59,656 |
| Dutch | 18.3 /100 | #201 | Poor $59,539 |
| Finns | 18.2 /100 | #202 | Poor $59,535 |
| Scotch-Irish | 16.9 /100 | #203 | Poor $59,447 |
| Arapaho | 16.0 /100 | #204 | Poor $59,383 |
| Immigrants | Sudan | 14.2 /100 | #205 | Poor $59,248 |