Immigrants from Norway vs South African Median Household Income
COMPARE
Immigrants from Norway
South African
Median Household Income
Median Household Income Comparison
Immigrants from Norway
South Africans
$94,846
MEDIAN HOUSEHOLD INCOME
99.8/ 100
METRIC RATING
62nd/ 347
METRIC RANK
$93,379
MEDIAN HOUSEHOLD INCOME
99.5/ 100
METRIC RATING
76th/ 347
METRIC RANK
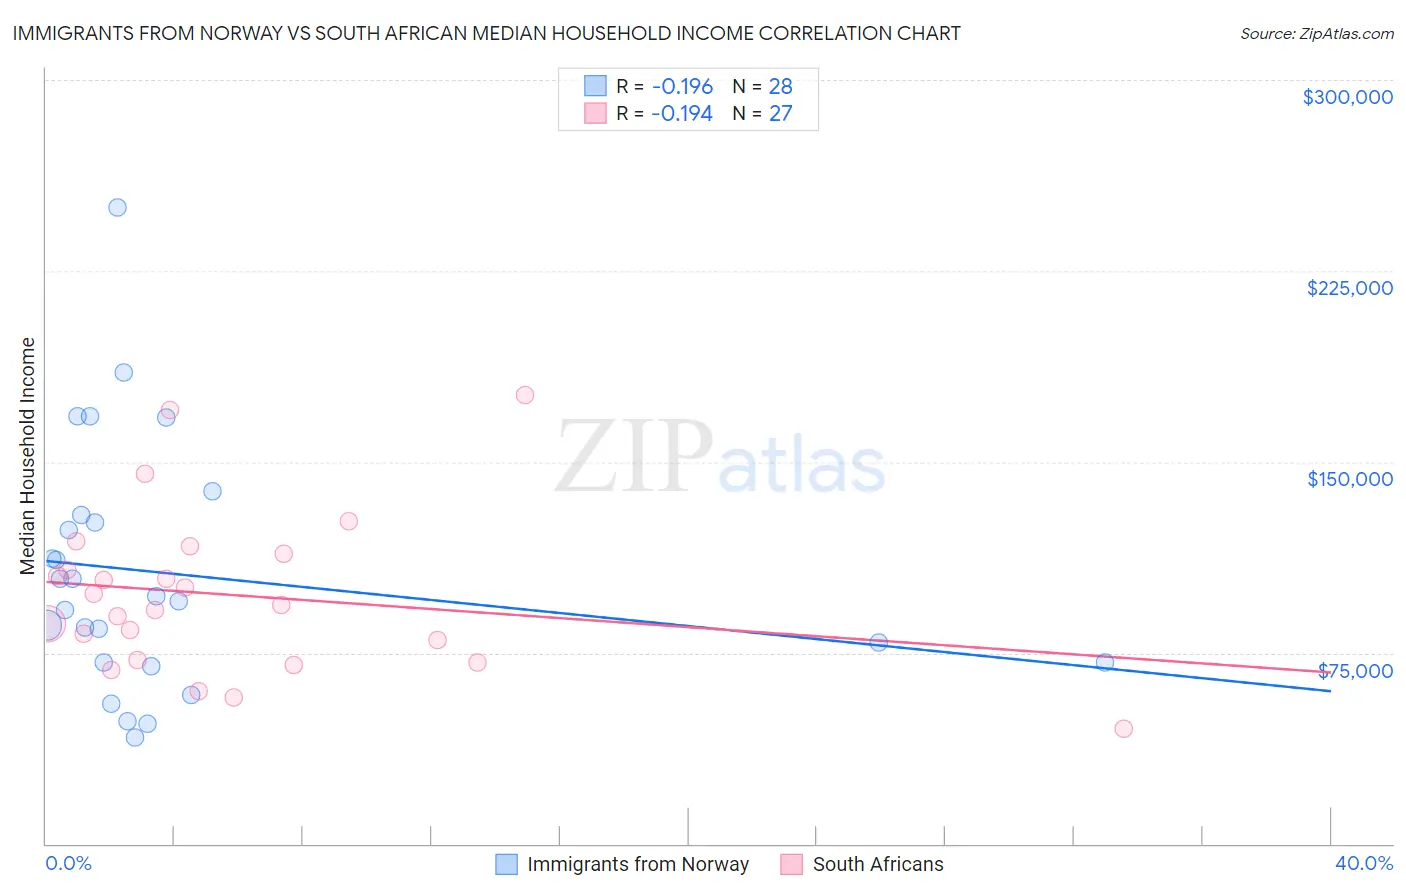
Immigrants from Norway vs South African Median Household Income Correlation Chart
The statistical analysis conducted on geographies consisting of 116,683,199 people shows a poor negative correlation between the proportion of Immigrants from Norway and median household income in the United States with a correlation coefficient (R) of -0.196 and weighted average of $94,846. Similarly, the statistical analysis conducted on geographies consisting of 182,537,527 people shows a poor negative correlation between the proportion of South Africans and median household income in the United States with a correlation coefficient (R) of -0.194 and weighted average of $93,379, a difference of 1.6%.
Median Household Income Correlation Summary
| Measurement | Immigrants from Norway | South African |
| Minimum | $41,875 | $45,000 |
| Maximum | $250,001 | $176,103 |
| Range | $208,126 | $131,103 |
| Mean | $106,024 | $97,725 |
| Median | $96,218 | $93,672 |
| Interquartile 25% (IQ1) | $71,155 | $72,324 |
| Interquartile 75% (IQ3) | $127,785 | $113,958 |
| Interquartile Range (IQR) | $56,630 | $41,634 |
| Standard Deviation (Sample) | $48,243 | $31,372 |
| Standard Deviation (Population) | $47,374 | $30,786 |
Demographics Similar to Immigrants from Norway and South Africans by Median Household Income
In terms of median household income, the demographic groups most similar to Immigrants from Norway are Greek ($94,735, a difference of 0.12%), Laotian ($94,990, a difference of 0.15%), Korean ($95,018, a difference of 0.18%), Immigrants from Europe ($95,032, a difference of 0.20%), and Immigrants from Netherlands ($94,411, a difference of 0.46%). Similarly, the demographic groups most similar to South Africans are Immigrants from Afghanistan ($93,375, a difference of 0.0%), Immigrants from Italy ($93,465, a difference of 0.090%), Immigrants from Latvia ($93,602, a difference of 0.24%), Immigrants from Bulgaria ($93,148, a difference of 0.25%), and Sri Lankan ($93,093, a difference of 0.31%).
| Demographics | Rating | Rank | Median Household Income |
| Immigrants | Europe | 99.8 /100 | #59 | Exceptional $95,032 |
| Koreans | 99.8 /100 | #60 | Exceptional $95,018 |
| Laotians | 99.8 /100 | #61 | Exceptional $94,990 |
| Immigrants | Norway | 99.8 /100 | #62 | Exceptional $94,846 |
| Greeks | 99.8 /100 | #63 | Exceptional $94,735 |
| Immigrants | Netherlands | 99.7 /100 | #64 | Exceptional $94,411 |
| Immigrants | Belarus | 99.7 /100 | #65 | Exceptional $94,399 |
| Immigrants | Romania | 99.7 /100 | #66 | Exceptional $94,222 |
| Immigrants | Scotland | 99.7 /100 | #67 | Exceptional $94,091 |
| Mongolians | 99.7 /100 | #68 | Exceptional $93,971 |
| Argentineans | 99.7 /100 | #69 | Exceptional $93,960 |
| Immigrants | Fiji | 99.7 /100 | #70 | Exceptional $93,933 |
| Immigrants | Philippines | 99.6 /100 | #71 | Exceptional $93,899 |
| Lithuanians | 99.6 /100 | #72 | Exceptional $93,852 |
| Immigrants | Egypt | 99.6 /100 | #73 | Exceptional $93,700 |
| Immigrants | Latvia | 99.6 /100 | #74 | Exceptional $93,602 |
| Immigrants | Italy | 99.5 /100 | #75 | Exceptional $93,465 |
| South Africans | 99.5 /100 | #76 | Exceptional $93,379 |
| Immigrants | Afghanistan | 99.5 /100 | #77 | Exceptional $93,375 |
| Immigrants | Bulgaria | 99.4 /100 | #78 | Exceptional $93,148 |
| Sri Lankans | 99.4 /100 | #79 | Exceptional $93,093 |